- Operations management
Operational Efficiency: Definition, Metrics, Examples, and a Practical Roadmap
Updated on 29 Jan 2026
Jump to
Summary

Operational efficiency means you deliver the same work with less time, less cost, and fewer errors, without lowering quality.
It shows how well your business turns inputs like time, labor, fuel, and tools into outputs like finished jobs, shipped orders, or closed tickets.
Track a small set of KPIs like operating ratio, cost per unit, cycle time, etc., to achieve maximum efficiency.
When you improve efficiency, customers get faster service, and your team gets breathing room,
What is Operational Efficiency?
Operational efficiency is the optimization of resources and business workflows to save money and minimize waste. At the same time, service quality or product remains top-notch. Basically, it is the way of finishing work with the least number of resources used.
When operations are efficient, teams spend less time:
- Waiting
- Fixing the same issues
- Searching for information
For example, a SaaS team can deliver the same number of features with fewer meetings and fewer bugs to fix later. The result is the same, but the cost is lower, so efficiency is higher.
Why Operational Efficiency Matters: Benefits & Business Impact
Costs, cycle times, and errors build as companies scale, which leads to big monthly losses. A reason why Operational Efficiency is important.
Microsoft's 2024 Work Trend Index points to 60% workers wasting time. They waste too much time on emails, chats, and meetings, which makes them feel as if they are always busy. But in reality, they aren't doing much. Better efficiency turns that busy time into completed work and cleaner customer delivery.
Lower Operating Costs Equal Stronger Margins
Lower operating costs come from removing rework, manual steps, and avoidable errors. McKinsey shared examples where companies cut the cost of poor quality by about 30%. And reduced rework by about 60% by improving how work is done and using ongoing improvement.
If your team does lots of repeat work, like invoice checks or status updates, automation works the best. Especially when the rules are clear, and the work does not change much. In those cases, the cost per transaction can drop quickly. [Source: APQC]

Faster Delivery and More Predictable Execution
Faster delivery happens when you cut down the waiting time between steps. In most processes, waiting time is often longer than the time spent doing the work.
APQC defines cycle time as the total time from start to finish. This includes both work time and waiting time. That is why making the steps visible can speed up delivery, even before you automate anything. [Source: APQC]
So, when you remove a bottleneck, delivery times become steadier. Customers then get more reliable ETAs and call less often for updates.
3) Better Customer Value
Better customer value means fewer mistakes, fewer repeat questions, and clearer delivery times. For example, Qualtrics found that $3.7 trillion in global sales is at risk each year. That is due to bad customer experiences. Again, small operational issues like a missed appointment can turn into real lost revenue.
4) Healthier Teams and Scalable Capacity
Stable workloads, clear handoffs, and fewer urgent emergencies create healthier teams. People often feel stressed because they do not know what will happen next, not because the work is hard.
Gallup’s global research links employee engagement to performance. It also estimates that low engagement costs about US$8.9 trillion each year worldwide. Improving how work runs protects people and also improves output.
Just so you know, when work is predictable, you can train new hires faster. You can also grow the team without chaos.
5) Agility and resilience when priorities change
Priorities change without disruption when the process is clear and broken into small parts. FYI, operational efficiency has to include three things. They are standard work, clear ownership, and regular performance reviews. And it's evident from the McKinsey report. They found that many transformations do not keep their improvements over time.
If you track a few early signals, you can find problems sooner. Then you can move people and time to fix issues before it affects customers.
6) Competitive Advantage and Investor Confidence
A competitive advantage comes from making the same promise and keeping it. You do it more reliably than others, even when costs rise or demand suddenly increases.
Operational efficiency also makes cash flow easier to predict. Investors and lenders like this as it reduces risk. And people trust business who show steady growth with simple KPIs.
Why it matters in markets too
Markets reward operational efficiency because it raises profit. And it makes earnings easier to predict. With steady cost and on-time delivery, more money can be put into the product, hiring, and customer support.
This discipline also makes growth safer. You grow a system that already works, instead of growing chaos.
See 30% growth in business
Make operations efficient
How to Measure Operational Efficiency

Measure operational efficiency using several metrics: cost, speed, quality, and cash. One metric alone can be misleading.
So, first, set a baseline. Then track the results every week or month to see if improvements last.
APQC shares standard metrics and benchmark data for finance and operations. This helps you compare your results with similar companies.
Calculate the Operational Efficiency Ratio
The operational efficiency ratio shows how much it costs to earn one unit of revenue. In many industries, you calculate it by dividing operating costs by net sales. A lower ratio usually means the business is more efficient. [Source: Wall Street Prep].
Use this ratio to track changes over time and to compare with similar companies in your industry. What counts as good depends on your cost structure.
Cost Metrics (Profit vs Cost)
Cost metrics show whether efficient work is truly raising profit or only moving costs to a different place. Track gross margin and operating margin. These show how well you turn sales into operating profit. [Source: Corporate Finance Institute].
Also track unit costs like cost per job, cost per ticket, or cost per invoice. These help you see what is causing the margins to go up or down.
Flow/Cash Movement Metrics
Cash metrics matter because a company can make a profit and still fail if it gets paid too late.
Track DSO and the time from invoice to payment. Link these numbers to missing approvals or invoice errors. Any specific steps that slow down payment?
Dun & Bradstreet’s Q3 2024 A/R report found that 19 out of 212 industry segments had 10% or more of past-due balances that were 91+ days late. This shows that slow collections are still common in real markets.
Measurement Routine of Operational Efficiency
A simple routine beats a complex dashboard you never use.
Review daily signals like backlog, on-time delivery, and error rates. Then review weekly trends like cycle time and cost per unit.
Run a monthly “root-cause” review for the top two misses, and turn each one into a small fix with an owner and a due date.
Turn field data into weekly KPI reports fast
How to Improve Operational Efficiency
Start small and focus on the biggest constraint. Trying to fix everything usually stalls. Use a mix of process fixes and system fixes, then measure the impact with a few KPIs.
Below are practical strategies that work in most of the cases:
1) Set Clear Goals and Track a Few KPIs
Set goals that describe an outcome. Pick 3–7 KPIs tied to cost, speed, quality, and cash. Define each KPI in plain language so everyone measures the same way. Review the KPIs on a fixed schedule, because what you review is what you improve.
2) Map the workflow to find waste
Map the workflow end-to-end, including the waiting time. It usually hides in handoffs and approvals. APQC’s cycle time definition includes both time spent working and time spent waiting. And it makes mapping more honest. So once you see the steps, remove one handoff or one approval loop and measure the change.

3) Automate Repeatable Work
Automate repeatable work after you standardize it. Microsoft’s 2024 Work Trend Index reports 85% of emails get read in under 15 seconds. It shows how much micro-work steals attention from real delivery. So use automation for tasks like data entry, alerts, and routing. And keep a human touch for exceptions and judgment.
4) Optimize Inventory
Optimize inventory by balancing availability and cash. Too much stock ties up money, while too little stock causes delays.
The CSCMP State of Logistics Report indicates that U.S. business logistics costs total about $2.3 trillion, or 8.7% of GDP. Which is why inventory and warehousing decisions matter in real dollars.
Use simple signals like stockout rate, inventory turns, and days of supply. Set reorder points based on lead time and demand variability.
5) Use Predictive Maintenance to Reduce Downtime
Use predictive maintenance when downtime costs a lot. It helps you fix issues before a machine fails. One avoided failure can prevent days of lost work.
Deloitte says predictive maintenance can cut maintenance planning time by 20–50%. It can also raise uptime by 10–20%. While lowering maintenance costs by 5–10% in many industrial sites.
Start with the 10 assets that cause the highest downtime cost. Add sensors or condition checks where the savings will be worth the cost.
6) Outsource Specialized Routine Work
If an external provider can do it faster, cheaper, or with fewer errors, outsource it. A good candidates include payroll and basic bookkeeping. Simple IT work with clear SLAs is also a good inclusion. Hence, keep key customer work in-house if it shapes your brand or needs close control.
7) Improve Transparency to Reduce Waiting
Improve transparency with a single source of truth for status, owners, and next steps. A shared dashboard or ticket view reduces waiting and starts processes to move work forward. Therefore, start with one workflow, then expand once the team trusts the data.
Automate check-ins with location-based logs
Try for free - No credit card required!
8) Reduce Energy Waste
Reduce energy waste when energy is a big cost line. Efficiency gains show up fast on the utility bill.
The IEA reports that global energy efficiency progress in 2024 remains around 1%. Meaning many organizations still leave savings on the table.
Start with energy audits, fix leaks, and idle running. Then invest in better motors, insulation, or controls where payback is clear.
9) Train People to Reduce Rework and Churn
Train people on the real standard process, not just the tool. Most rework starts with unclear expectations. Build short checklists and job aids for the top five error types, then coach in the flow of work.
Better training also lowers churn because people feel competent faster.
10) Capture Economies of Scale
Capture economies of scale only after you standardize. Scaling up can make good things better, but it can also make problems bigger.
Standard work helps you buy in bulk, plan in one place, and reuse templates. And it does so without hurting quality.
When the process stays steady, you can grow teams, add locations, or expand service areas. The risk is minimal.
Operational Efficiency vs Productivity vs Operational Excellence
These three terms sound alike, but they mean different things in a business. Here's a quick look at them.
| Term | Focus | Benefits | Challenges |
|---|---|---|---|
Operational Efficiency | Reducing waste and lowering costs | Standardize how work is done; smooth handoffs between people/teams | Chasing speed without fixing waste can still create rework and quality issues |
Productivity | Output per time/effort (e.g., jobs per technician-day, tickets per agent-hour) | Improve throughput and time usage; measure output rates | Can rise even when waste is high (people work faster but redo later); helps measure efficiency, but doesn’t tell the full story alone |
Operational Excellence | Long-term improvement and consistency, even when leaders change | Standard work, coaching, clear problem-solving steps, regular review meetings | Mixing it up with efficiency or productivity can lead to short-term gains that hurt quality; lasting results come from a system, not one-off projects.. |
Stop status-chasing with one unified live dashboard
How to Spot Inefficiency?
Inefficiency usually shows up as delays, errors, and “urgent” work that never goes away. Look for patterns across weeks, not single bad days. Because real process issues repeat. Start with two questions: “Where do we wait?” and “Where do we redo?”
Common Symptoms
Common symptoms are late deliveries, many urgent issues, and work that keeps moving back and forth between teams.
Another red flag is when people ask for status updates all day because no one trusts the data.
You may also see high overtime without a matching rise in finished work.
Root Causes
Root causes often come from unclear owners. Too many handoffs and work that depends on “what people know” instead of a clear process are also major issues.
Missing or incomplete data also creates waste. Teams retype the same details in different tools or spend time looking for missing info.
Frequent priority changes also cause hidden rework. Teams stop mid-task and later have to start again.
A Practical Operational Efficiency Roadmap
A roadmap keeps efficient work focused. Which allows you to make progress without turning it into a never-ending program. Treat this like a cycle: baseline, improve, standardize, and repeat.
Each step below should produce a visible output that the team can use.
Step 1: Define What “Efficient” Means
Define “efficient” using outcomes that matter:
- Cost per unit
- Cycle time
- Error rate
- Customer SLA.
Agree on what quality means, too, so you do not trade speed for mistakes.
Write the definitions down and share them, because alignment is a real efficiency win.
Step 2: Baseline Your Performance
Baseline performance with the last 8–12 weeks of data. Do not just consider one good week. Capture both the average and the variation, because variation creates surprises over time. Use this baseline to set targets that feel ambitious but realistic.

Step 3: Map the Workflow End-to-End
Map the workflow from customer request to delivery and payment. Do not only consider the middle steps your team owns. After that, mark each step as value-add, required but non-value-add, or waste, then total the waiting time. Then take photos or screenshots of the map and keep it visible. Hidden workflows stay broken.
Step 4: Fix the Biggest Bottleneck First
Fix the biggest bottleneck first. Improving non-bottlenecks rarely changes the outcome.
Pick one constraint and run small experiments. Changing an approval rule or adding a clear intake form are two good constraints to consider.
Measure the impact in a week or two and keep what works.
Step 5: Standardize Repeatable Work
Standardize repeatable work with simple SOPs, checklists, and templates.
Keep the standard short enough that people actually use it. Update it when reality changes.
This standard becomes your base for training and automation.
Step 6: Automate the Predictable
Automate standardized, predictable steps, like
- Routing
- Reminders
- Data capture
- Status alerts.
APQC says RPA works best for high-volume work that does not change much and follows clear rules. Which makes it a smart first automation target. (Source: APQC).
Keep a manual override for exceptions so automation stays safe and trusted.
Step 7: Build a Cadence
Build a cadence with short daily huddles and deeper weekly reviews.
Use the daily time to remove blockers. Use the weekly time to solve root causes.
Make the cadence non-negotiable. Consistency is what makes gains stick.
Step 8: Scale with Discipline
Scale improvements by copying the system, not by copying hero behavior.
Document what changed, train teams, and track the same KPIs across sites or teams.
When performance drifts, treat it as a signal to fix the system, not to blame people.
Build a 30-day efficiency plan you can run
Start for Free - No credit card required!
Tools & Systems That Enable Operational Efficiency at Scale
Tools do not create efficiency on their own, but they can lock in standard work and make data visible. Pick tools that match your process maturity. Complex tools can create new waste.
Below are the common tool categories and what they actually help with.
1) Systems of Record (ERP / Centralized Ops Tools)
Systems of record create one place for
- Orders
- Inventory
- Customers
- Costs.
They reduce rework because people stop re-entering the same data in five places.
Choose an ERP or ops platform that fits your workflows, then keep the setup simple at first.
2) Process Mapping and Workflow Automation Tools
To stop work from getting lost, workflow tools make visible:
- Steps
- Owners
- Approvals
Use them to enforce intake rules, route tasks, and create audit trails for compliance.
Start with one high-volume process, then expand once the team trusts the flow.
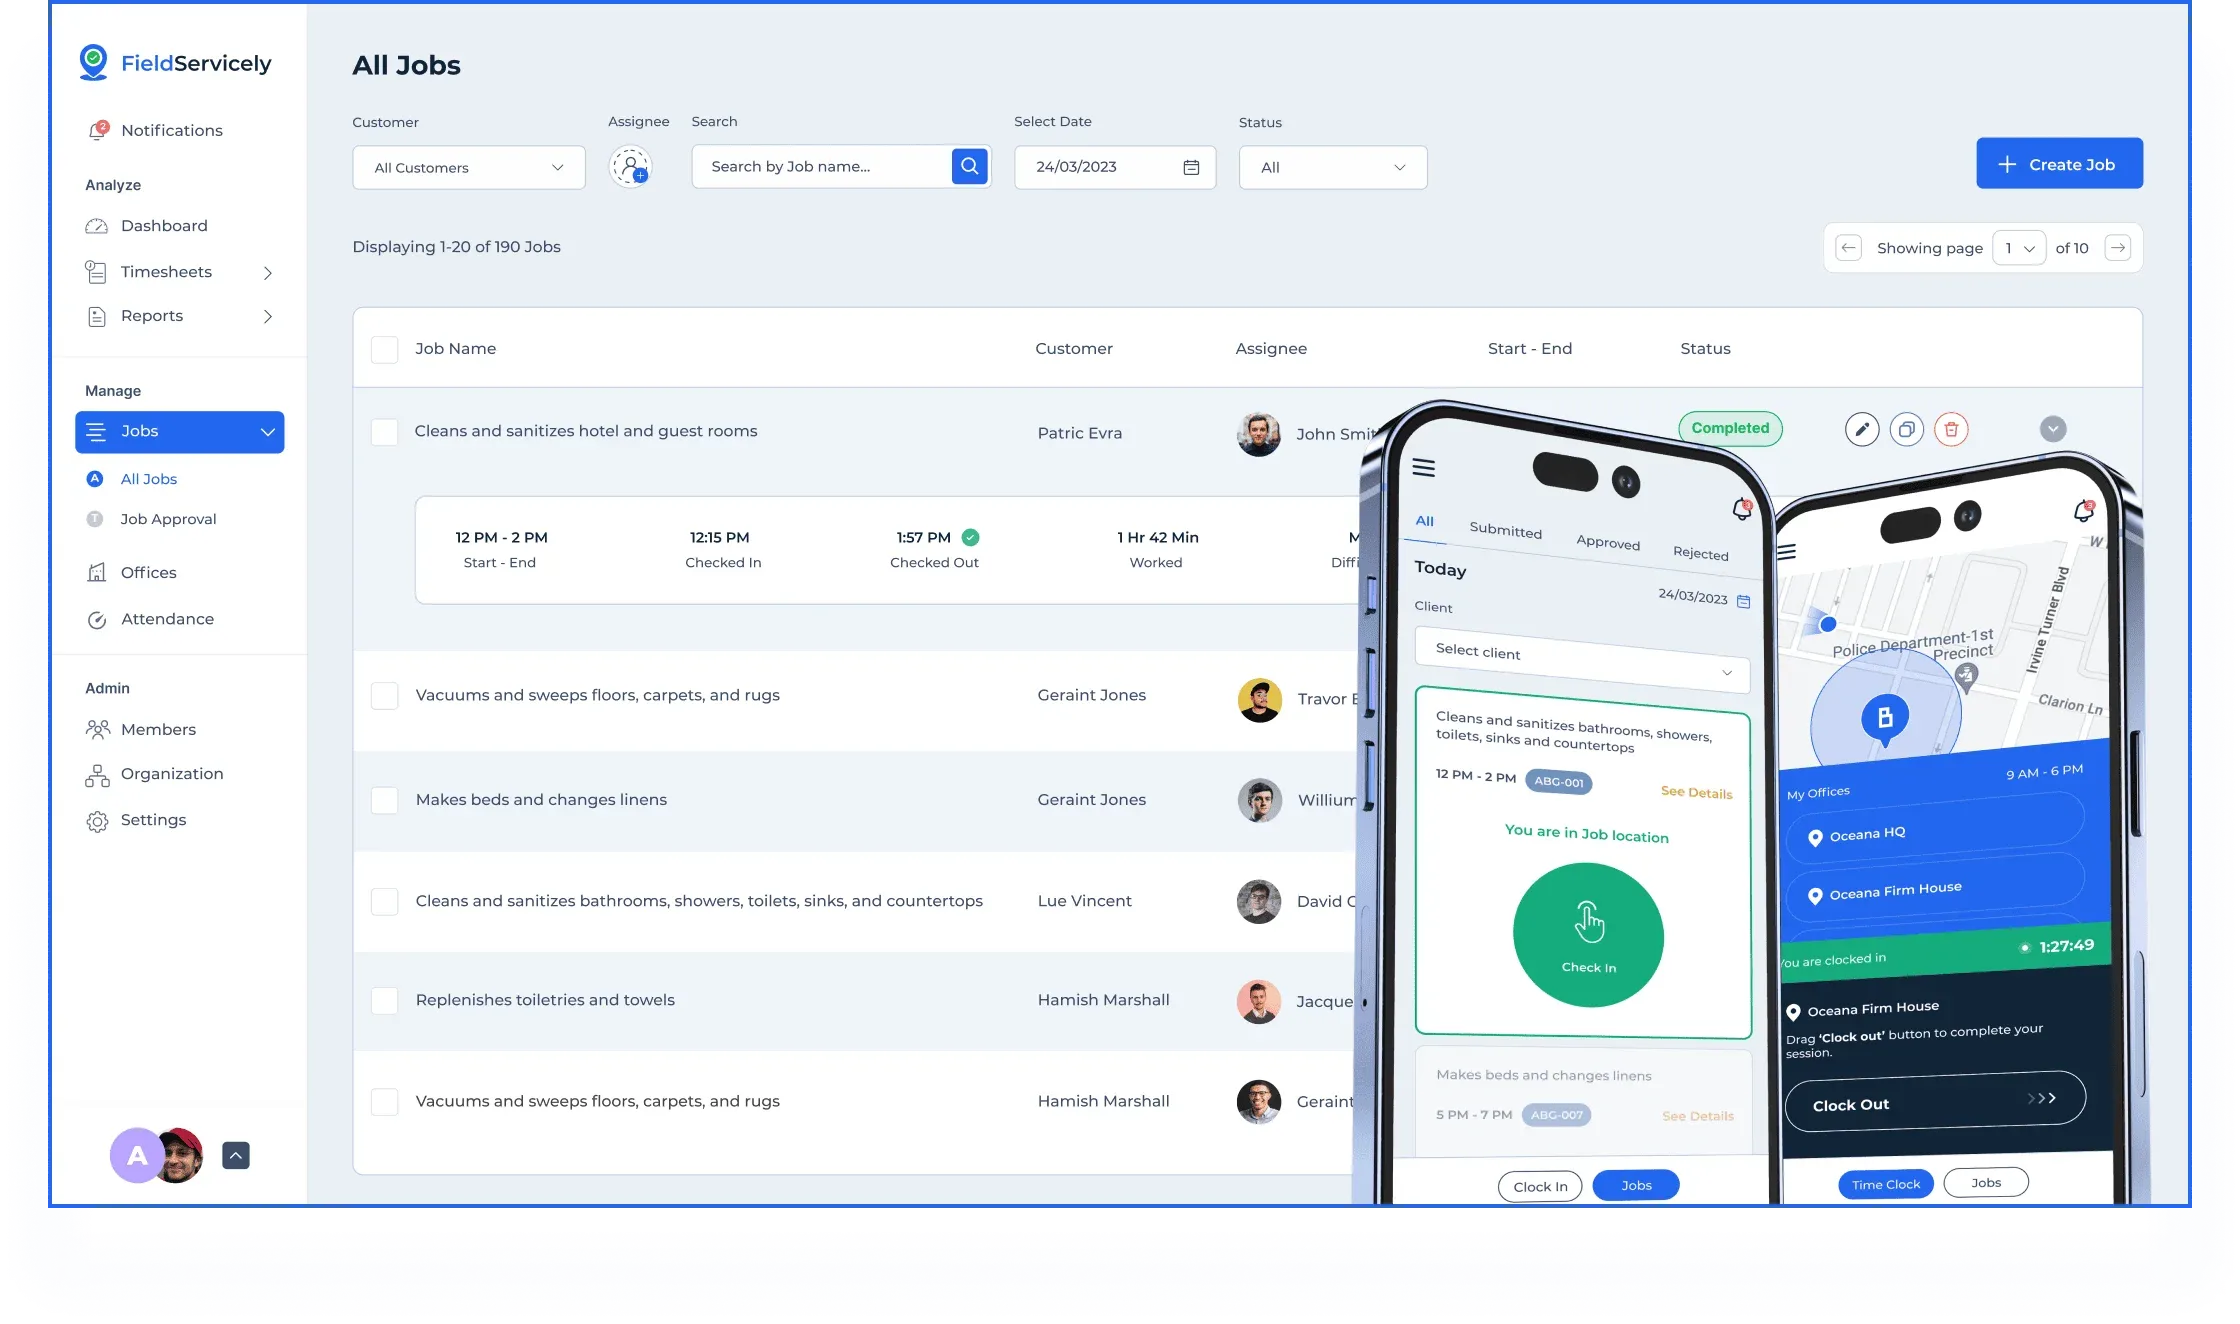
3) Scheduling, Dispatch, and Field Execution
Scheduling and dispatch tools cut wasted travel time and help field teams arrive on time.
They work best when they can show centralised
- Jobs
- Locations
- Arrival times
- Technician Skills
Even simple route planning can reduce missed visits and keep customers updated.
Make dispatch, time, and payroll flow together
4) Time tracking, Attendance, and Payroll
Time and attendance tools help you understand where labor hours actually go. Use the data to spot overtime drivers like
- Rework
- Long Travel
- Unclear priorities.
When payroll stays accurate and timely, trust goes up, and disputes go down.
5) Invoicing and Cash Flow tools
Cash flow tools help you
- Send Invoices Faster
- Cut Billing Mistakes
- Follow up on Payments sooner.
APQC tracks how long it takes to go from invoice to payment, and how often payments go out with no errors. These measures show why finance work matters for operational efficiency.
Link invoicing to job completion so you can bill right away without extra admin work.
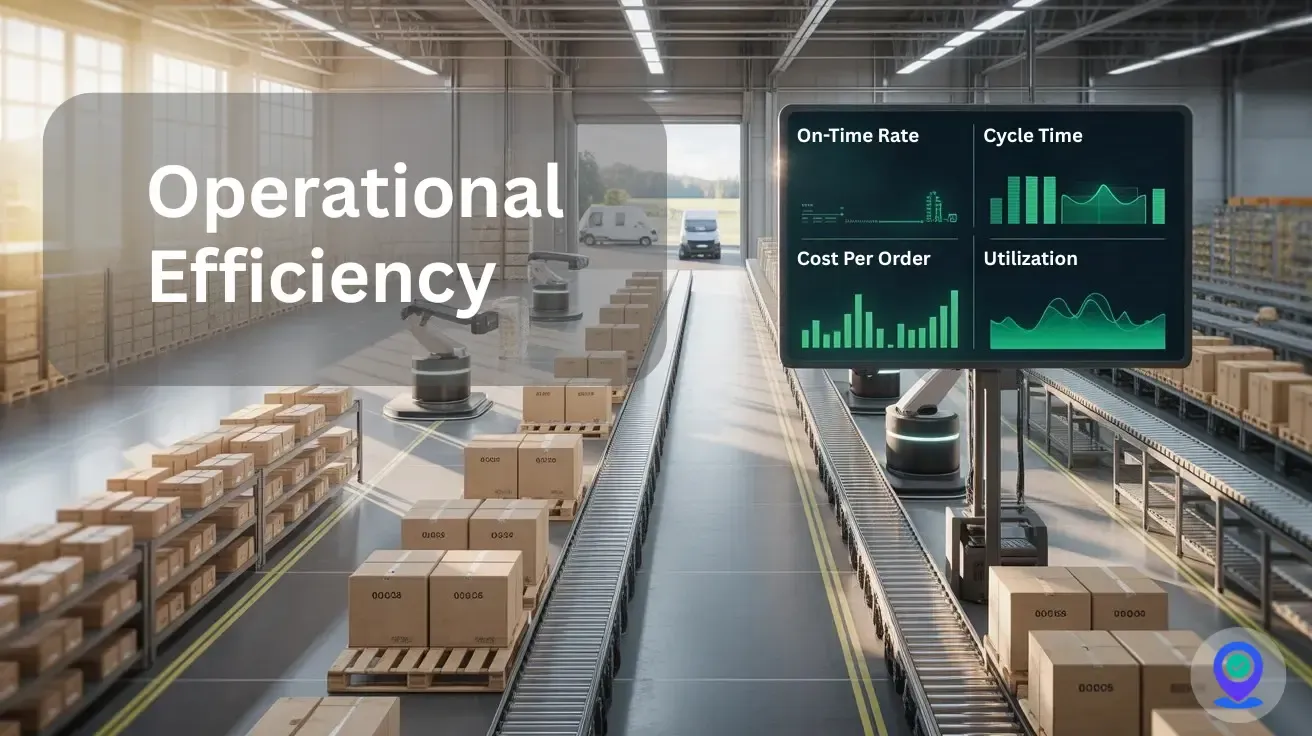
6) Dashboards and Metrics
Dashboards turn raw data into daily signals like backlog, on-time rate, and cycle time.
Keep dashboards simple and tied to decisions. Too many charts create new noise.
Use the dashboard in meetings so the data drives action, not just reporting.
Bottom Line
In the first 30 days, focus on visibility and one high-impact bottleneck. Do not think too much on big “transformation.”
Pick one workflow, measure it, and improve it, then repeat the playbook on the next workflow.

