Construction Productivity Tracking: Methods, Metrics, Tools
Updated on 13 Mar 2026
Jump to
Summary

Construction productivity tracking measures how efficiently labor turns into completed work.
Metrics like labor hours, production rate, and schedule performance reveal jobsite efficiency.
Teams track productivity using digital time tracking, reports, and equipment monitoring.
Real-time data improves bidding, scheduling, and project profitability.
Common productivity issues include material delays, downtime, and poor coordination.
Construction productivity tracking is the process of measuring how efficiently labor, equipment, and materials turn into completed work on a jobsite. This tracking helps project teams control costs, improve schedules, and protect profit margins.
When managers see productivity data in real time, they can quickly adjust crews, equipment, or materials before delays grow. However, many contractors still struggle with manual reporting, inaccurate timesheets, and limited jobsite visibility, which makes productivity harder to measure.
That is why understanding productivity tracking matters for modern construction projects. In this blog, we will explore how construction productivity tracking works, the tools used, and the best ways to implement it effectively.
What Is Construction Productivity Tracking
Construction productivity tracking measures how efficiently crews turn labor hours into completed work. In simple terms, it shows how much output a team produces per unit of time spent on site.
For example, if a crew installs 1,000 square feet of drywall in 20 labor hours, the productivity rate equals 50 square feet per labor hour.
The system connects time data with real production results. Basic time tracking only records when workers clock in and out. Productivity tracking links those hours to installed quantities, cost codes, equipment usage, and project budgets to show true work performance.
Contractors collect this data through daily field reports, mobile apps, or project management platforms. Supervisors record labor hours, materials installed, and equipment usage as work progresses. Managers then compare planned production targets with actual output to detect inefficiencies early.
This insight helps control labor costs and scheduling risks. According to a construction cost survey, construction costs represent 64.4% of the total sales price of a new home in the U.S.
See how labor hours turn into real jobsite output
Track productivity, tasks, and crew performance in real time
Why is Construction Productivity Important?
Rising Project Costs
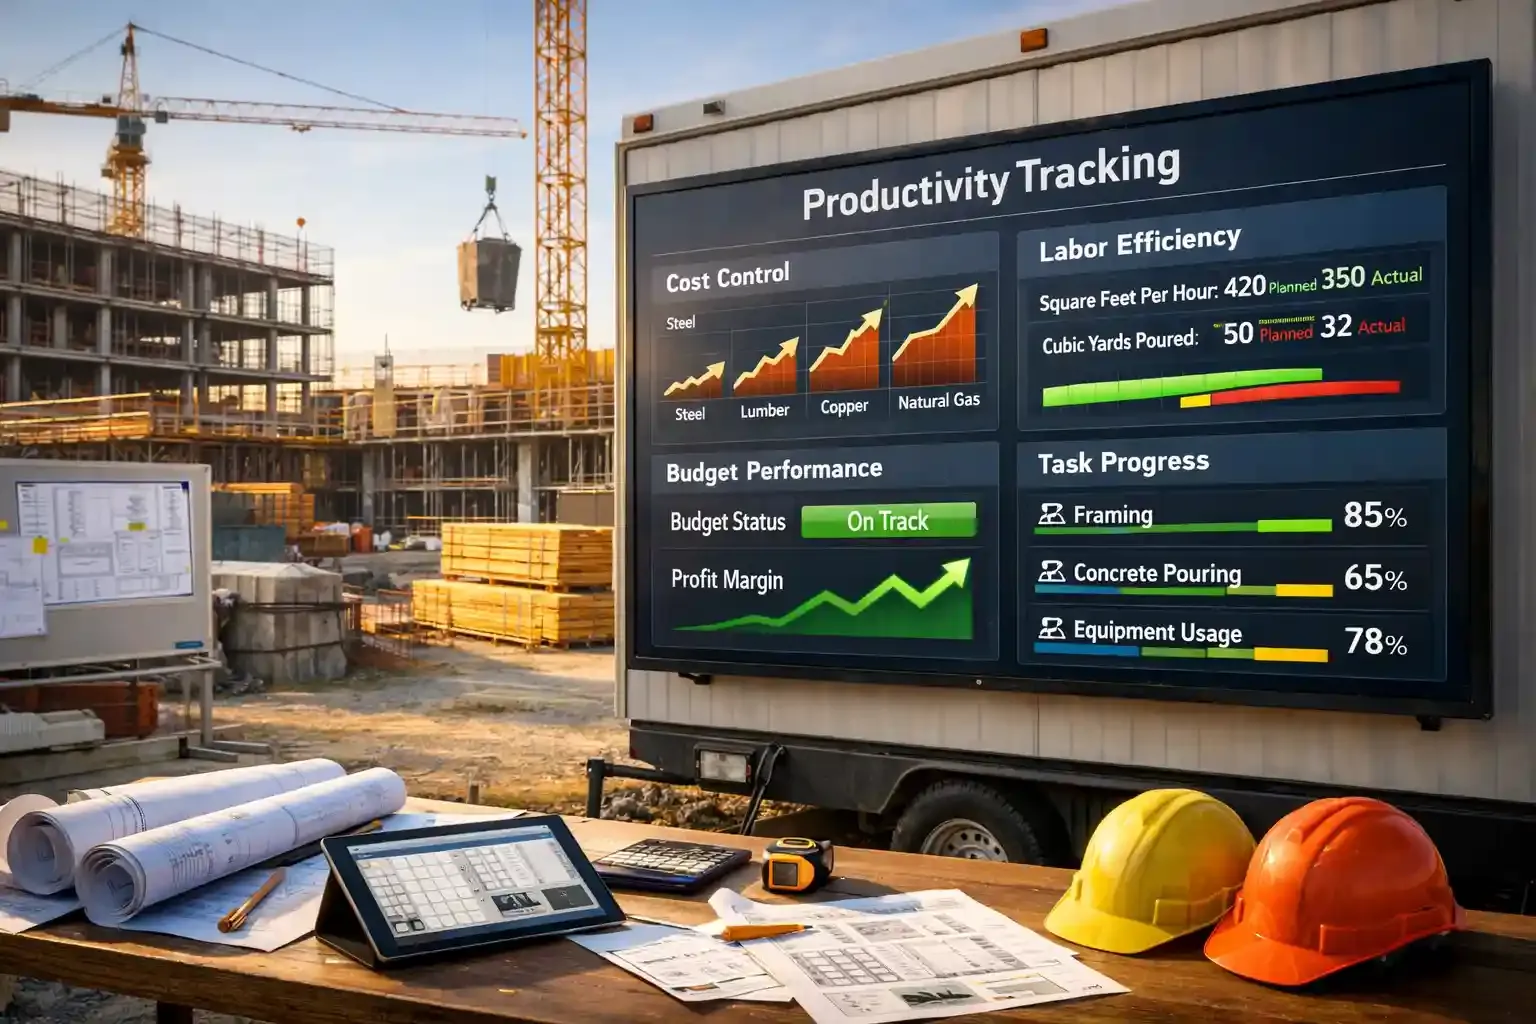
Construction costs continue to rise across the industry. Construction input prices now sit more than 40% higher than February 2020 levels, driven by increases in materials such as natural gas, steel, copper, and lumber.
Because labor often represents 20%-50% of total project costs, even small productivity losses quickly increase expenses.
Productivity tracking helps contractor businesses control these rising costs. When managers see that a framing crew installs fewer square feet per hour than planned, they immediately investigate delays, skill gaps, or equipment problems.
This early visibility prevents small inefficiencies from turning into major financial problems.
Preventing Budget Overruns
Budget overruns remain one of the biggest problems in construction projects. These overruns often happen because managers detect productivity issues too late.
Productivity tracking prevents this problem by showing real-time performance data. For example, if a concrete crew planned to pour 50 cubic yards per day but only completes 30, managers immediately adjust labor or equipment before the budget drifts further.
That quick response protects project budgets and keeps work aligned with the original estimate.
Protecting Profit Margins
Construction profit margins remain extremely thin across the industry. According to McKinsey, construction is among the least profitable industries, with average margins often in the mid-single digits.
A single productivity issue can erase those profits quickly.
Productivity tracking protects margins by identifying wasted labor hours. When supervisors notice idle crews or slow task completion, they redistribute workers to more productive tasks.
As a result, contractors keep labor costs aligned with project revenue.
Making Faster Decisions
Construction projects change constantly due to weather delays, labor availability, and material delivery issues. Without productivity tracking, managers often rely on weekly reports that hide problems for several days.
Real-time tracking gives managers immediate insight into job-site performance. If a scheduled task stalls because materials arrive late, supervisors can reassign the crew to another activity instead of wasting an entire shift.
This faster decision-making improves project coordination and reduces schedule delays.
Know when productivity starts slipping
Monitor crews, output, and labor hours in real time
How to Measure Construction Productivity?
- Define productivity as output vs input: Construction productivity measures how much work a crew completes compared to the resources used, such as labor hours, equipment time, and materials.
- Track key inputs first: Contractors usually record labor hours, material usage, equipment time, energy consumption, and indirect costs for a specific time period.
- Resources VS completed work: Teams then measure how much work was finished, such as square feet installed or cubic yards poured, and compare it with those inputs.
- Use a simple productivity formula: A common method is Productivity = Units of Work Completed ÷ Labor Hours Worked. This shows how efficiently crews convert time into output.
- Analyze productivity with real examples: For instance, if electricians need 65 hours to rewire a 1,200 sq ft building, managers evaluate whether delays, material issues, or labor gaps affected performance.
- Measure at different project levels: Companies may track productivity for a single task, one project phase, or across multiple projects to identify trends and improve planning.
Tracking the right productivity metrics helps construction managers understand how efficiently work happens on site. These metrics connect labor input with actual output, which makes it easier to detect delays, cost overruns, and inefficiencies early
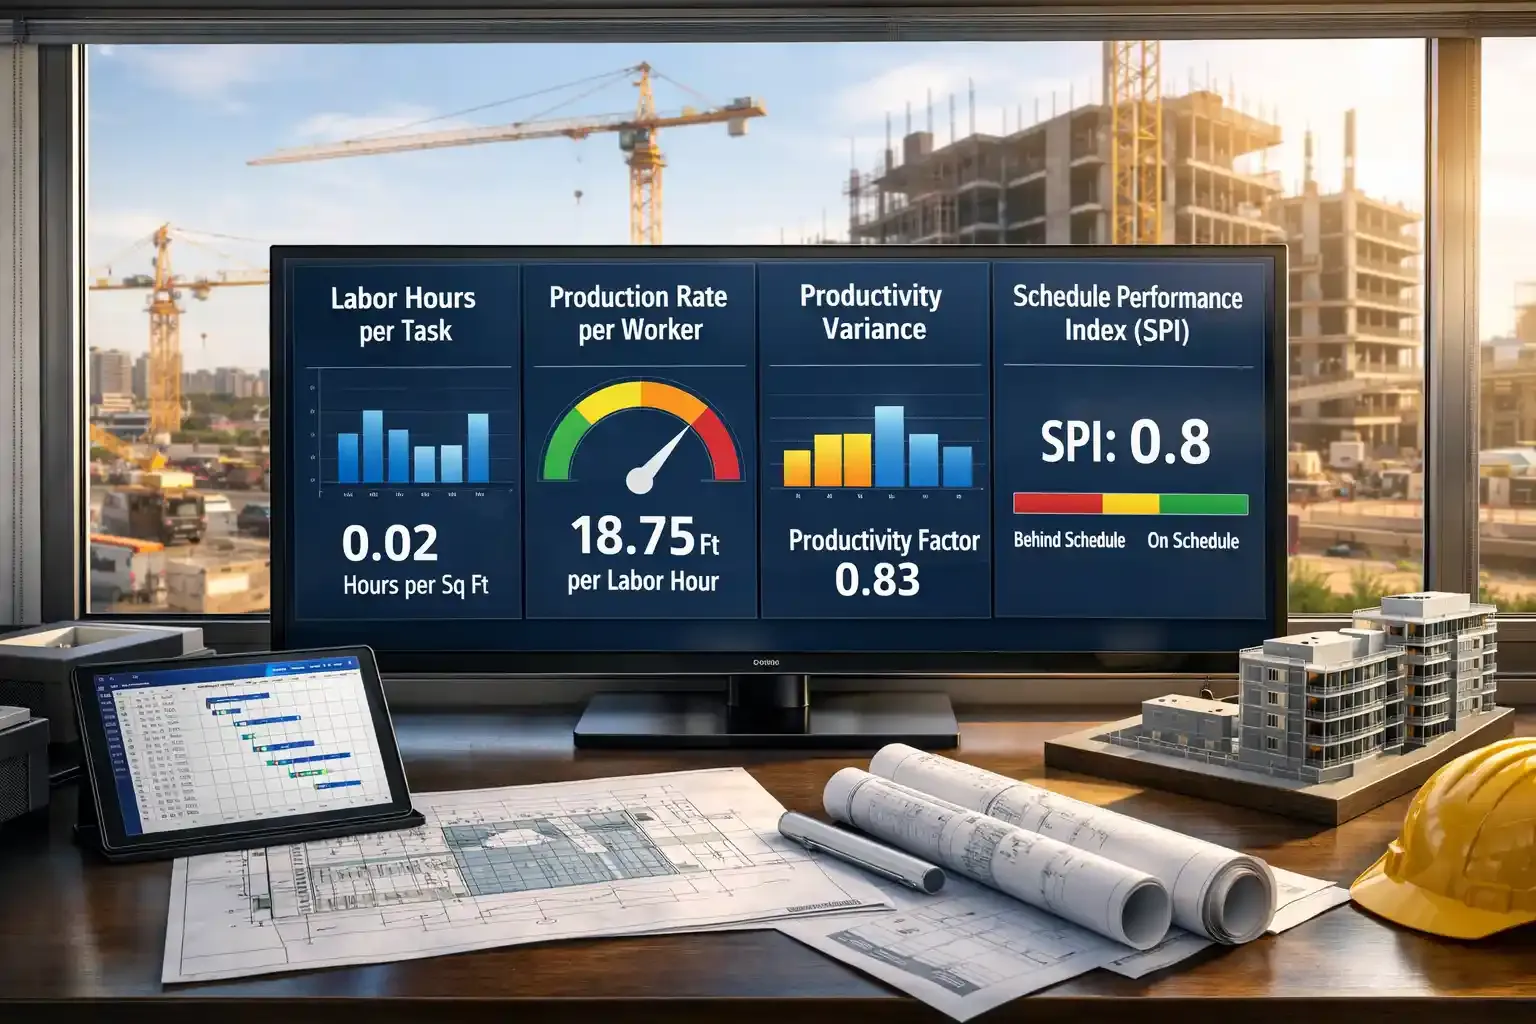
Labor Hours per Task
Labor hours per task measure how much labor time crews spend completing a specific activity. Managers use this metric to understand whether a task consumes more hours than planned. The formula is:
Labor Hours per Task = Total Labor Hours ÷ Units of Work Completed
For instance, if a crew installs 1,000 sq ft of drywall using 20 labor hours, the labor hours per task equal 0.02 hours per sq ft.
This metric reveals inefficiencies quickly. If the same task suddenly requires 30 hours instead of 20, managers investigate delays, workforce issues, or missing materials.
Production Rate per Worker
Production rate per worker measures how much output a worker produces in a given time period. It shows the real productivity of crews on site. The formula is:
Production Rate per Worker = Total Installed Quantity ÷ Total Labor Hours
If electricians install 150 feet of conduit in 8 labor hours, the production rate equals 18.75 feet per labor hour.
Managers use this metric to compare actual productivity with estimated production rates. The BLS provides updated productivity statistics for the construction industry through 2024, showing long-term stagnation relative to the broader economy.
Productivity Variance
Productivity variance measures the difference between planned productivity and actual field performance. This metric helps managers detect when crews work slower or faster than expected.
Productivity Variance = Earned Hours ÷ Actual Labor Hours
For example, if a task was expected to take 100 hours but crews completed it using 120 hours, the productivity factor equals 0.83. It signals lower productivity.
According to a study, tracking performance variance allows contractors to detect deviations between planned and actual progress early. This enables corrective actions that help prevent schedule delays and cost overruns.
Schedule Performance
Schedule performance measures whether construction work progresses according to the planned project timeline. Managers commonly track this using the Schedule Performance Index (SPI). The formula is:
Schedule Performance Index (SPI) = Earned Value ÷ Planned Value
Suppose a project planned $100,000 worth of work, but completed only $80,000. Then the SPI becomes 0.8, which indicates the project is behind schedule.
This metric helps teams respond quickly to delays. The Study explains that construction projects frequently experience time overruns. It highlights persistent delays caused by planning issues, labor productivity problems, and material management challenges.
Know exactly how efficiently your crews work
Measure production rates and labor hours in real time
Methods for Tracking Construction Productivity
Construction productivity becomes clearer when teams track how labor, equipment, and materials move across the jobsite. These are different methods for tracking construction productivity:
Digital Time Tracking
Digital time tracking records when workers start tasks, stop tasks, and how long each activity takes. Mobile apps, biometric time clocks, and GPS-based systems now capture this information directly from jobsites and link labor hours to cost codes or project phases.
For example, when an electrician clocks into conduit installation through a mobile system, those hours automatically connect to the correct task and project budget.
Did you know time theft costs U.S. employers more than $11 billion annually? Digital time tracking improves labor accuracy and payroll reliability.
Daily Field Reports
Daily field reports document the real conditions of a construction site each day. Supervisors record crew size, completed tasks, delays, equipment usage, and weather conditions through digital reporting tools. This daily record builds a continuous timeline of project activity.
Because reports capture events immediately, managers detect problems faster.
For instance, if a concrete pour slows due to late material delivery, the supervisor logs the delay in the field report. It allows project managers to adjust crew assignments before the schedule suffers.
Equipment Monitoring
Equipment monitoring tracks how machines operate throughout the workday. GPS trackers, IoT sensors, and telematics systems record runtime, idle time, and equipment utilization automatically. This data shows whether machinery contributes to productivity or remains underused.
Idle equipment often signals coordination problems and can cost about $35 per hour for a bulldozer in fuel and wear.
Once equipment usage becomes visible, project managers can adjust schedules or machine assignments. This helps reduce downtime and improve overall job-site efficiency.
Material Tracking
Material tracking monitors deliveries, inventory levels, and consumption across the project lifecycle. Barcode scanning, RFID tags, and digital inventory systems help teams track materials from delivery to installation.
This ensures crews always have the supplies required to continue work.
Material shortages remain one of the most common causes of productivity loss. According to research, material procurement and supply chain issues significantly affect project schedules, contributing to delays in many construction projects
Tracking material usage also helps identify waste early. When installed quantities do not match expected consumption levels, managers quickly investigate measurement errors, damaged materials, or procurement issues.
Output and Quantity Tracking
Output tracking measures how much physical work crews complete during a given time period. Contractors record measurable units such as cubic yards of concrete poured, square feet of flooring installed, or linear feet of piping completed. This method directly connects labor input with project progress.
Production data reveals whether teams meet expected productivity levels. For example, if a framing crew installs 800 square feet per day instead of the planned 1,200, the production gap signals a productivity issue that requires attention.
According to a study, structured production tracking systems improve schedule reliability and project performance by providing real-time feedback and measurable performance indicators.
Know exactly what happens on your jobsite each day
Connect field reports, time tracking, and progress in one system
Benefits of Construction Productivity Tracking
When teams measure productivity consistently, they improve cost control, scheduling accuracy, and workforce performance across the entire project.
Protecting Project Profit
Construction productivity tracking protects profit by revealing labor inefficiencies early. Labor typically accounts for 40%-50% of project costs, so even small productivity drops quickly affect margins.
Once managers see which tasks consume more hours than planned, they adjust crew assignments or resolve workflow bottlenecks. As a result, contractors stop profit leakage before labor overruns compound across the project.
Improving Bid Accuracy
Productivity tracking improves bid accuracy because contractors finally work with real production data instead of assumptions. When historical job site data shows how long crews actually take to install drywall, pour concrete, or run conduit, estimators can build far more realistic cost models.
This is important because inaccurate estimates remain common in construction. A study found that poor forecasting and inaccurate productivity assumptions remain major causes of project cost overruns worldwide.
Reliable productivity data, therefore, strengthens both estimating confidence and bidding competitiveness.
Better Schedule Control
Productivity tracking improves schedule control by identifying delays before they impact the critical path. When managers compare daily production output with planned quantities, they quickly see whether crews fall behind.
This early signal allows teams to reassign workers, adjust deliveries, or change sequencing before delays grow. According to research, real-time performance monitoring significantly improves schedule reliability across complex projects.
Higher Workforce Efficiency
Productivity tracking improves workforce efficiency because teams finally see how time translates into output. Managers can identify high-performing crews, detect training gaps, and understand which tasks consistently slow down.
This visibility leads to smarter workforce planning. According to a study, structured productivity measurement helps contractors optimize labor deployment and improve project performance across multiple sites.
Stronger Accountability Across Teams
Productivity tracking increases accountability across employees, subcontractors, and temporary labor. When labor hours connect directly to tasks and locations, disputes about time worked become much easier to resolve.
This transparency also improves billing accuracy for time-and-material projects. Verified jobsite data reduces contractual disputes because project stakeholders share the same performance records. [Source: ResearchGate]
Faster Operational Decisions
Productivity tracking enables faster operational decisions because managers see project performance in real time instead of waiting for weekly reports. When data reveals a stalled activity or a resource shortage, supervisors can react immediately.
That responsiveness prevents small problems from becoming expensive delays. Automated monitoring systems capture visual and spatial data from construction sites in real time, allowing teams to track progress and identify issues earlier. [Source: ScienceDirect]
Protect project margins before costs escalate
Track labor productivity and jobsite performance in real time
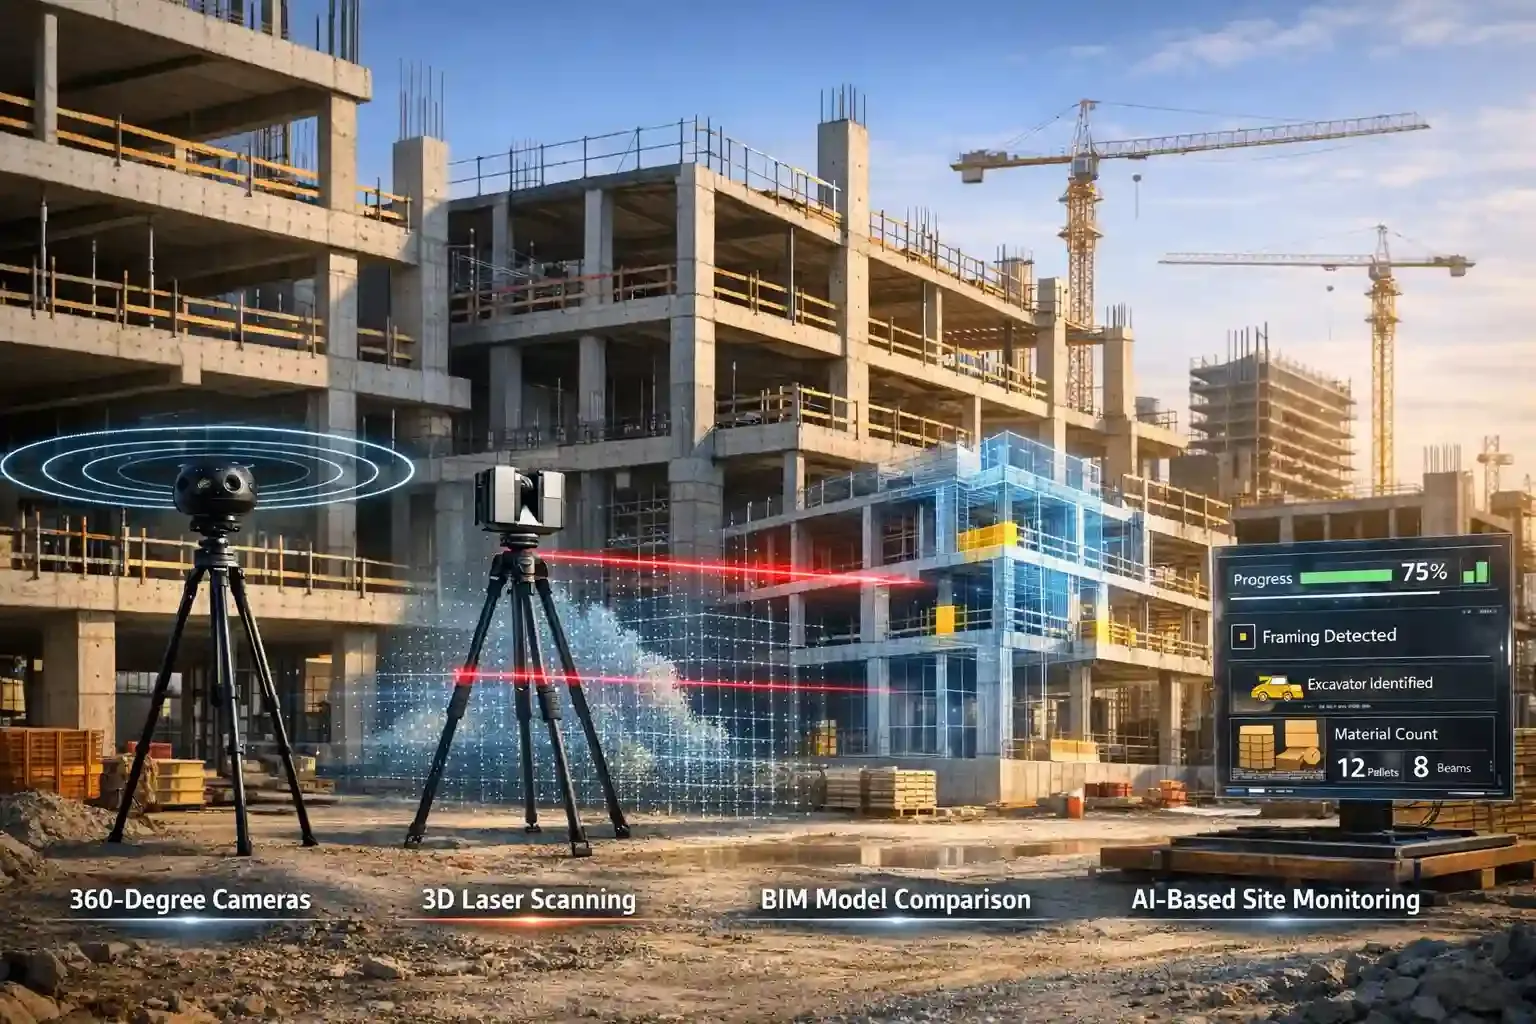
Automated Construction Progress Monitoring
Construction teams no longer rely only on manual walkthroughs to understand project progress. Today, automated monitoring tools capture visual and spatial data directly from the jobsite and turn it into measurable insights.
360-Degree Cameras
360-degree cameras help teams capture the entire jobsite during a simple walkthrough. A worker mounts the camera on a helmet or tripod, walks through the site, and the system automatically records every angle of the environment.
But here’s the real advantage.
Instead of reading a daily report, you can actually see the site exactly as it looked that day. According to a study, visual documentation technologies (photos, video, and site imaging) improve project coordination.
3D Laser Scanning
3D laser scanning answers an important question many project managers ask: Does the built structure match the design?
A laser scanner sends thousands of laser pulses per second to measure surfaces and capture the exact shape of the building.
The result is a highly detailed digital model of the site. According to MDPI, laser scanning enables precise dimensional verification and supports quality control during construction.
BIM Model Comparison
Once field data is captured, the next step is comparing it with the design plan. BIM comparison tools overlay real-world construction data onto the digital building model to detect differences between what was planned and what was actually built.
Why does this matter so much?
Because even small misalignments can create major rework later. Research showed that BIM-based clash detection systems can automatically detect conflicts between architectural, structural, and MEP models.
This improves coordination and reduces construction errors.
AI-Based Site Monitoring
AI monitoring tools take automation one step further by analyzing job site photos, video feeds, and sensor data automatically. These systems detect construction activity, identify materials or equipment, and measure progress without requiring manual inspection.
Imagine receiving a notification that framing work slowed down or that safety compliance dropped in a certain area. AI algorithms surface patterns and trends that provide early signals for schedule delays and project risks. [Source: CMIC Global]
Stop relying only on manual walkthroughs
Track jobsite progress with visual and automated monitoring
Common Causes of Low Construction Productivity

Material Delays
Material delays slow productivity because crews cannot work without the required supplies. When steel, concrete, or electrical components arrive late, workers often wait instead of progressing to the next task.
This waiting time quickly multiplies across teams.
Supply chain disruption in 2026 will remain constant and structural. Geopolitical fragmentation, evolving trade regulations, and labor shortages are reshaping how value is created and distributed, said Per Kristian Hong, Partner at Kearney. [Source: WeForum]
Equipment Downtime
Equipment downtime reduces productivity when machines stop operating during critical project phases. Excavators, cranes, or concrete pumps sitting idle can halt multiple tasks simultaneously.
This issue happens more often than many managers expect. According to a study, unplanned equipment downtime is one of the leading causes of lost productivity on construction sites.
Poor Workforce Planning
Poor workforce planning creates productivity problems when crews arrive without the right skill mix or staffing levels. Too few workers slow progress, while too many workers cause congestion and inefficiency on the jobsite.
This imbalance affects productivity across trades. Do you know that about 70% of contractors struggle to find qualified workers, which often disrupts project staffing and task scheduling.
Communication Gaps
Communication gaps reduce productivity when teams lack clear information about tasks, schedules, or design changes. Miscommunication between project managers, subcontractors, and field crews often leads to repeated work or delays.
These breakdowns appear frequently in complex projects. Poor communication and data fragmentation continue to impact project efficiency across the construction sector.
Rework and Quality Issues
Rework slows productivity because teams must redo tasks that were already completed. Errors in installation, measurement mistakes, or design misunderstandings force crews to repeat work.
This problem has a significant cost impact. Rework can consume a notable share of project labor hours, which directly affects schedule performance and productivity.
Understand where productivity breaks on-site
Track jobsite data and fix bottlenecks faster
How To Improve Construction Productivity
- Capture data in real time: Use mobile tools or digital logs so productivity data comes from the field as work happens.
- Track work by cost codes: Break projects into tasks like framing, electrical, or concrete to see exactly where labor hours go.
- Measure output, not just hours: Compare completed work (sq ft installed, yards poured) with the time spent.
- Review productivity weekly: Check production reports regularly so you catch delays before they grow.
- Use consistent reporting methods: Standard templates for daily logs make productivity data easier to compare.
- Train field teams to record data correctly: Accurate input from crews keeps productivity metrics reliable.
- Connect labor data with schedules: Linking production rates with the schedule helps identify slow tasks quickly.
- Use historical data for improvement: Past project productivity benchmarks help plan future work more accurately.
Conclusion
Construction productivity tracking helps contractors understand how efficiently work actually happens on the jobsite. When teams track labor hours, production output, and task progress consistently, they gain clear insight into delays, cost overruns, and workflow problems.
More importantly, productivity tracking turns jobsite data into smarter decisions. Contractors can improve bidding accuracy, protect profit margins, and plan future projects using real performance data instead of assumptions.
Frequently Asked Questions
What is the formula for construction productivity?
The basic formula for construction productivity is Productivity = Output ÷ Input. In most projects, output means completed work, such as square feet installed or cubic yards poured, while input usually refers to labor hours.
What are the main productivity metrics used in construction projects?
The most common construction productivity metrics include labor productivity, production rate, unit cost, equipment utilization, and schedule performance. These metrics connect resources like labor hours, materials, and equipment with the amount of work completed.
What is the difference between time tracking and productivity tracking?
Time tracking simply records when workers start and stop work. Productivity tracking goes further by linking those hours to completed output, such as installed materials, cost codes, or project tasks. This connection helps managers understand whether labor hours actually produce expected results.
What tools are used to track construction productivity?
Construction companies commonly use construction management software, digital time tracking apps, BIM platforms, IoT equipment sensors, and AI-based monitoring tools. These systems capture field data in real time and convert it into productivity reports that managers can use for decision-making.
How can contractors improve construction productivity on job sites?
Contractors improve productivity by tracking real-time jobsite data, monitoring production rates, improving workforce planning, and using digital reporting tools. Clear communication, proper scheduling, and accurate cost code tracking also help teams identify delays early and keep projects on schedule.

