Small Business Metrics: 12 KPIs That Matter (+Formulas)
Updated on 26 Feb 2026

Jump to
Summary

Small business metrics are key performance indicators that show how your company earns, spends, and grows over time.
Core financial KPIs like net profit margin, cash flow, gross margin, and burn rate protect sustainability.
Profitability and scalability of business depend on CAC, CLV, retention, and conversion rate.
Operational metrics like inventory turnover, revenue per employee, payroll, and operating cost ratio protect margins.
Tracking 5–10 focused KPIs, reviewing trends monthly, and linking every metric to clear decisions turns small business metrics into a real control system.
Small business metrics are the numbers that show you what’s really happening inside your business. They track revenue, profit margin, cash flow, customer acquisition cost, retention rate, and operational efficiency. So you can see where growth is real and where it’s fragile.
When you read them correctly, they help you make decisions based on performance. But the problem is that many business owners either track too many KPIs or focus only on revenue while ignoring profit and cash flow.
I’ve seen businesses celebrate record sales while struggling to pay suppliers two weeks later. That gap usually comes from misunderstanding which small business metrics actually matter.
In this blog, we’ll break down the essential small business metrics you should track and how many KPIs are actually enough. We’ll also cover common mistakes and show you how to use these metrics to protect profit and scale.
What Are Small Business Metrics?
Small business metrics are measurable indicators that track your financial health, operational efficiency, and customer loyalty. Things like net profit margin, cash flow, revenue growth rate, customer acquisition cost (CAC), customer lifetime value (CLV), and retention rate.
Have you ever had a “good sales month” but still felt stressed about money? That’s because revenue is not the full story.
Cash flow tells you whether you can pay salaries next month. And this is not a small issue. 65% of small business owners said they could only cover one month of expenses with their current cash reserves.
Then there’s profit.
Net profit margin tells you how much money you actually keep after paying rent, payroll, tools, ads, and taxes. In many industries, a 10% net profit margin is considered healthy, and 20% is strong. If you are working hard but sitting at 3% or 4%, something is broken.
Now think about customers.
Acquiring a new customer can cost five to 25 times more than retaining one. So if your retention rate drops, your marketing cost goes up automatically.
Operational metrics answer another question. Are you efficient, or just busy?
When you track these metrics month over month, patterns start to show. Small declines. Small leaks. Small warning signs. And that’s the whole point.
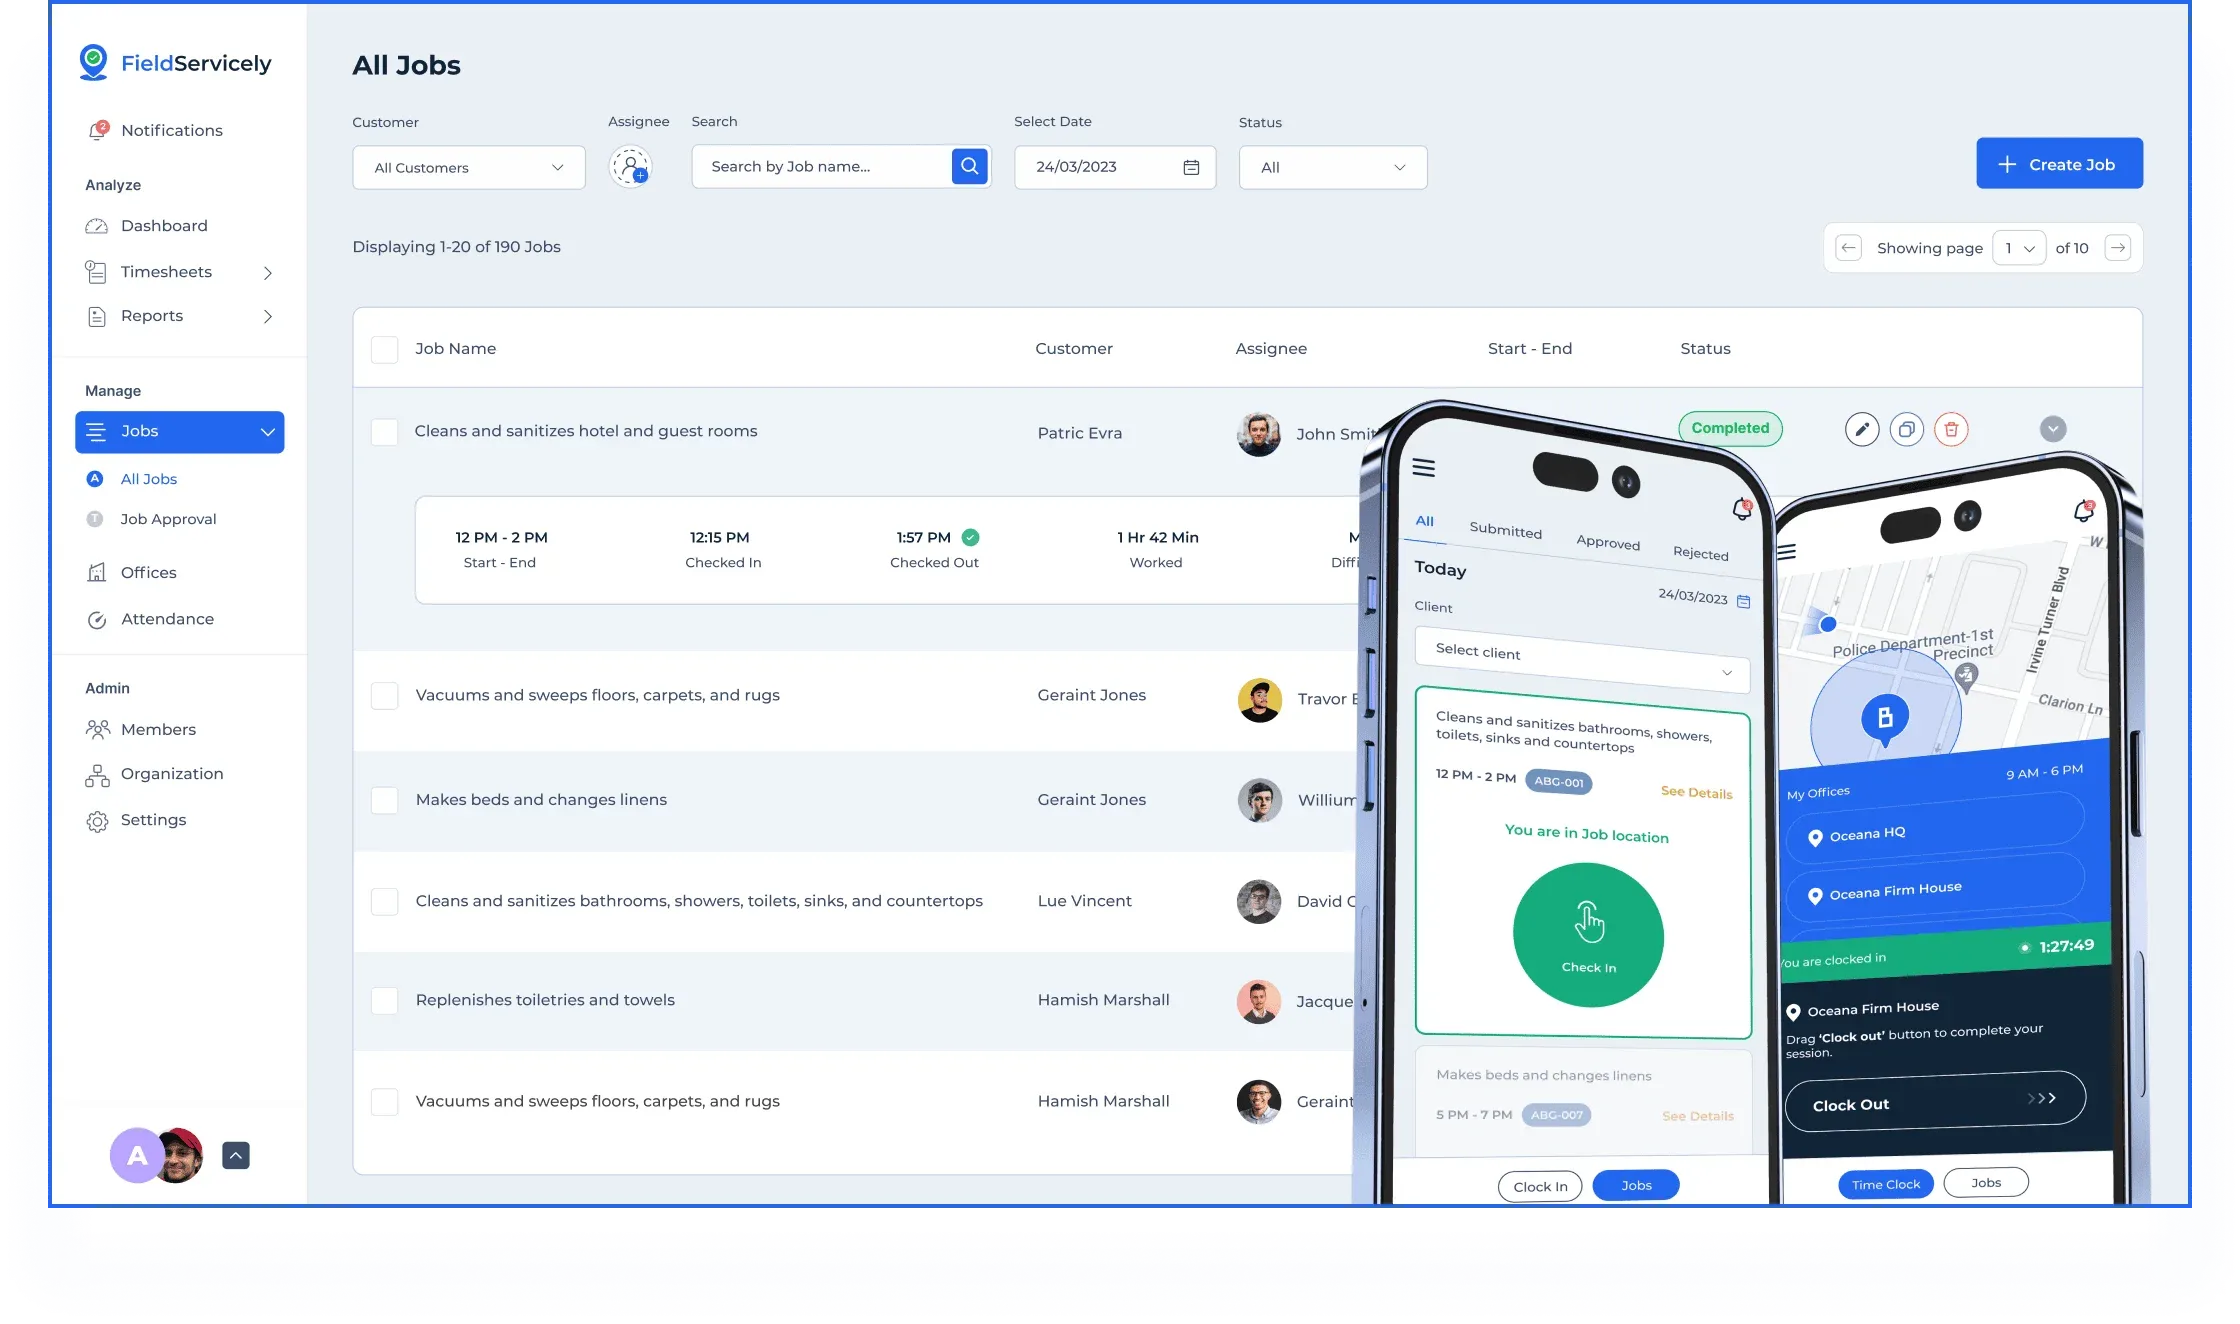
Catch small leaks before they become big losses
Track technician hours, job costs, and productivity trends
Small Business Metrics At a Glance
| Category | Metric | What It Tells You | Formula | Healthy Target |
|---|---|---|---|---|
Financial | Net Profit Margin Cash Flow Gross Profit Margin Burn Rate A/R Turnover | How much profit do you keep after all expenses If you can pay bills and payroll If pricing covers production costs How fast are you losing cash How fast do customers pay you | (Net Income ÷ Revenue) × 100 Inflow − Outflow (Revenue − COGS) ÷ Revenue Monthly Expenses − Revenue Net Credit Sales ÷ Avg A/R | 10% healthy, 20% strong Must stay positive Industry dependent Lower is safer Faster is better |
Customer | CAC CLV Retention Rate Conversion Rate NPS / CSAT | Cost to acquire one customer Total value of a customer over time % of customers who stay Leads that turn into buyers Customer satisfaction & loyalty | Sales & Marketing ÷ New Customers Avg Purchase × Frequency × Lifespan (End − New) ÷ Start Customers ÷ Leads Survey score | Must be lower than CLV 3× CAC minimum Higher is better Improve steadily Higher = stronger loyalty |
Operational | Inventory Turnover Revenue Per Employee Payroll Ratio Opex Ratio | How fast you sell stock Productivity per team member % of revenue spent on labor % of revenue spent on overhead | COGS ÷ Avg Inventory Revenue ÷ Employees Payroll ÷ Revenue Operating Expenses ÷ Revenue | Higher = efficient 3–4× salary cost 15%–30% typical 60%–80% common |
Top Financial Metrics for Small Business

Financial metrics tell you one thing. Is your business actually healthy, or does it just look busy?
Most owners track revenue. I did too. But revenue alone hides problems. The real answers lie in profit, cash, costs, and how quickly money moves.
Let’s go through the numbers that actually matter.
Net Profit Margin
Net profit margin shows how much money you keep after all expenses are paid. It measures the percentage of revenue left after payroll, rent, tools, ads, and taxes.
The formula is:
Net Profit Margin = (Net Income ÷ Revenue) × 100.
A 10% net profit margin is considered healthy in many industries. A 20% margin is strong. If you are below 10%, your pricing, labor cost, or operating expenses likely need attention.
Profitability is a key indicator of long-term sustainability. Without healthy margins, growth increases stress instead of stability.
Cash Flow
Cash flow shows how much money comes in and how much goes out. It measures liquidity, not accounting profit.
Operating cash flow is important because you cannot pay salaries with projected revenue. According to a news report citing small business survey data, 65% of owners said they could only cover one month of expenses with their current cash reserves.
That means one slow month can create panic.
Profitable businesses still fail when cash dries up. You can show profit on paper and still miss payroll if invoices are unpaid.
Gross Profit Margin
Gross profit margin shows how efficiently you produce or deliver your product. It measures revenue minus cost of goods sold (COGS).
The formula is:
Gross Profit Margin = ((Revenue − COGS) ÷ Revenue) × 100.
Gross margin tells you if your pricing works. If supplier costs rise or you discount too often, gross margin drops first.
Have you noticed costs rising quietly? Fuel, materials, shipping, software subscriptions. If your gross margin shrinks month after month, your cost structure needs adjustment.
This metric is an early warning system for pricing and production efficiency.
Burn Rate
Burn rate shows how fast you spend cash each month. It measures monthly net cash loss.
Burn Rate = Monthly Expenses − Monthly Revenue.
Burn rate matters most for startups and growing businesses. If you hold $150,000 in cash and burn $25,000 per month, your runway is six months.
Runway equals available cash divided by monthly burn. Many founders avoid this number until it becomes urgent.
But tracking burn rate forces discipline. It tells you when to cut costs, raise funding, or accelerate revenue before pressure builds.
Accounts Payable and Receivable Turnover
Accounts receivable turnover shows how fast customers pay you. Accounts payable turnover shows how fast you pay suppliers.
Receivable Turnover = Net Credit Sales ÷ Average Accounts Receivable.
If customers take 60 or 90 days to pay, your cash stays stuck. According to a survey, regularly reports that delayed payments create working capital stress for small firms.
Now flip it.
If you pay suppliers in 15 days but collect in 60, you create a cash gap. That gap forces you to use credit or dip into reserves.
These turnover metrics directly affect your cash cycle. Faster collection and balanced payment timing improve liquidity without increasing sales.
Revenue looks good. But what about profit?
Track margin, cash flow, and real business health in one place
Customer and Sales Metrics That Drive Growth and Loyalty
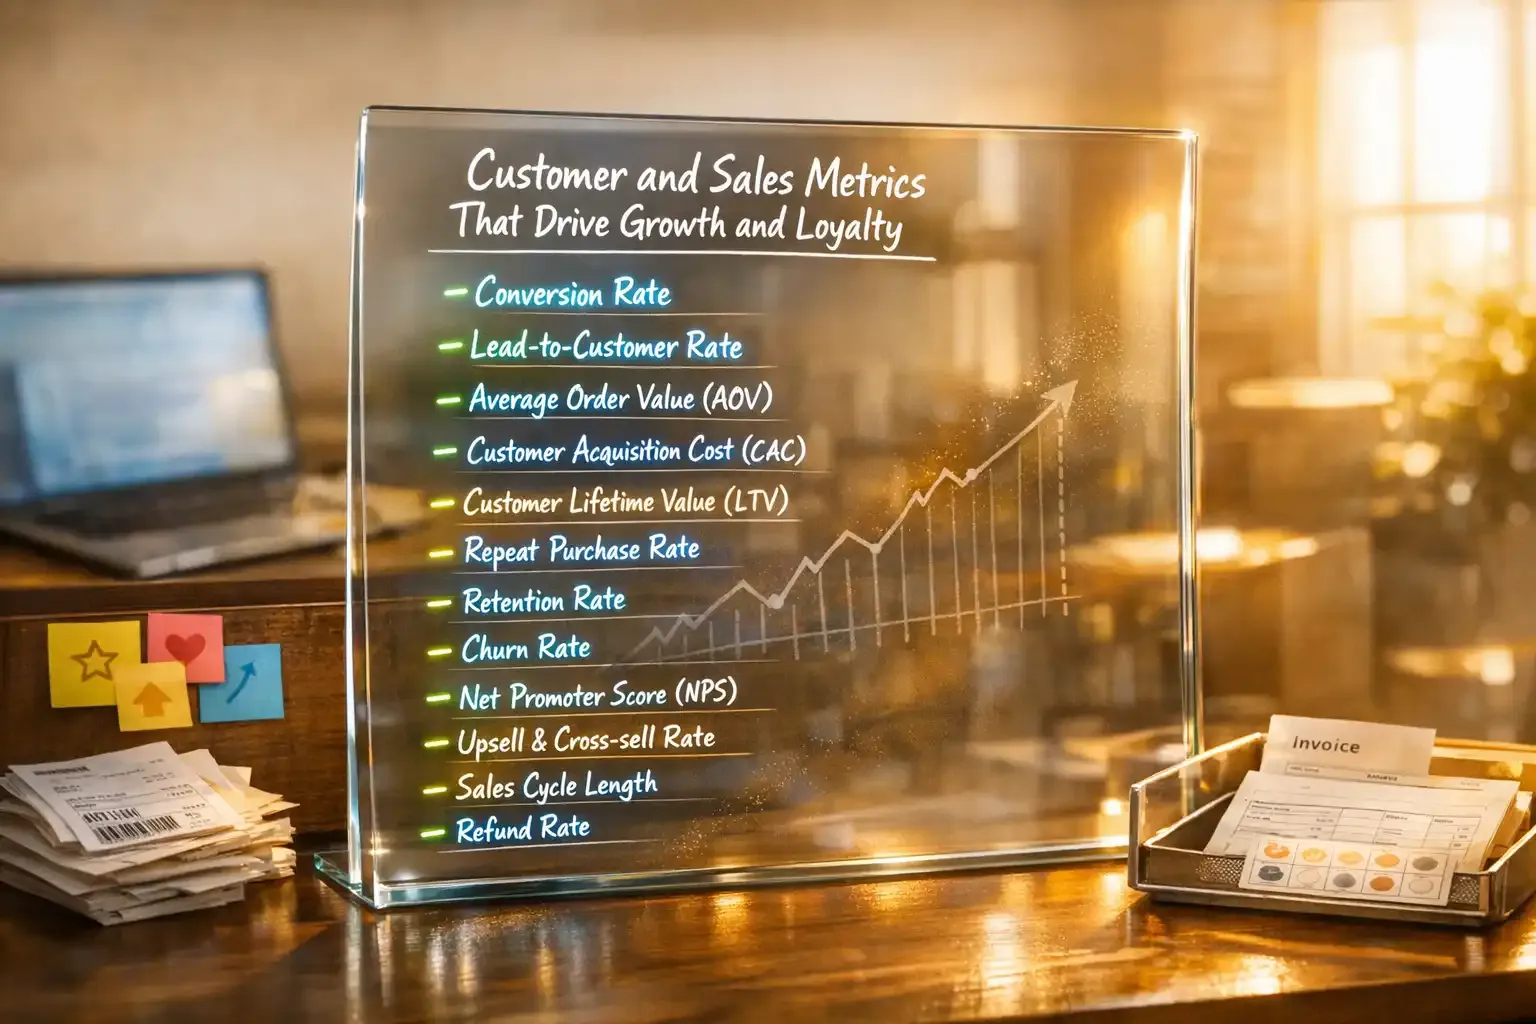
Customer and sales metrics answer: Is your growth profitable, efficient, and sustainable?
These metrics focus on how you acquire customers, how long they stay, how much they spend, and how efficiently your sales process converts interest into revenue. Let’s break them down:
Customer Acquisition Cost (CAC)
Customer Acquisition Cost shows how much you spend to acquire one new paying customer. It includes marketing spend, paid ads, sales salaries, commissions, tools, agency fees, and anything else tied directly to acquiring customers.
The formula is simple:
CAC = Total Sales and Marketing Expenses ÷ Number of New Customers Acquired.
Now here’s where things get real.
Imagine you spend $30,000 in one month across ads, sales salaries, and tools. If you gain 100 new customers, your CAC is $300. That number is not good or bad on its own. It only becomes meaningful when you compare it to what each customer is worth.
High CAC kills profit quietly. You may see revenue growing, but if acquisition costs rise faster than customer value, your margins shrink. Many small businesses scale ads before understanding this number, and that creates pressure instead of profit.
Customer Lifetime Value (CLV or LTV)
Customer Lifetime Value shows how much total revenue you expect from a single customer over their relationship with your business. It answers how valuable each customer is over time.
The standard way to calculate it is:
CLV = Average Purchase Value × Purchase Frequency × Average Customer Lifespan.
Let’s say a customer spends $80 per purchase, buys four times per year, and stays for three years. That equals $960 in lifetime revenue. Now compare that to your CAC.
The healthy benchmark most growth-focused businesses aim for is a 3:1 LTV to CAC ratio. That means if it costs you $200 to acquire a customer, you should generate at least $600 from them over time.
If your ratio drops below 2:1, growth becomes fragile. If it reaches 3:1 or higher, you have room to scale marketing safely.
Customer Retention and Churn Rate
Customer retention rate measures how many customers continue buying from you over a specific period. Churn rate measures how many leave.
Retention directly impacts profitability. According to a report, profits can be boosted by as much as 95 % with a 5 % increase in retention.
That is leverage.
When customers stay longer, they buy more. They trust more. They refer more. They require less marketing spend over time.
Have you noticed that replacing lost customers feels exhausting? That is churn draining your momentum.
Retention protects your CLV. It lowers the effective acquisition cost. It increases long-term profit without increasing ad spend.
Conversion Rate
Conversion rate shows how many leads turn into paying customers. The formula is simple:
Conversion Rate = Number of Customers ÷ Number of Leads.
But does this influence revenue? It does. In fact, revenue depends on three core variables:
Revenue = Traffic × Conversion Rate × Average Order Value.
If you drive 10,000 website visitors and convert 1%, you generate 100 customers. If you improve conversion to 2%, you generate 200 customers without increasing traffic.
Many businesses focus only on traffic growth. Fewer focus on improving conversion. Yet improving conversion often increases profit faster because it does not require additional ad spend.
Conversion rate also reveals funnel problems. If leads are high but sales are low, your messaging, pricing, trust signals, or follow-up process may need adjustment.
Net Promoter Score (NPS) and CSAT
Net Promoter Score measures how likely customers are to recommend your business to others. Customer Satisfaction Score measures how satisfied customers feel after a specific interaction or purchase.
Customer loyalty predicts repeat business. Repeat business increases CLV. Higher CLV strengthens your LTV: CAC ratio.
Satisfied customers also refer others, which reduces your effective acquisition cost. Word-of-mouth lowers CAC naturally because trust already exists before the first purchase.
When NPS or CSAT drops, churn often increases within months. These scores act as early warning signals for loyalty issues before revenue declines.
Know your acquisition cost before scaling ads
Monitor customer value and revenue efficiency in real time
Operational and Productivity Metrics That Protect Profit

You can increase sales by 20% and still feel squeezed at the end of the month. You can hire more people, stock more inventory, run more ads, and still wonder why margins are not improving.
Operational and productivity metrics measure how efficiently you move inventory, how productive your team is, and how tightly you control costs.
Inventory Turnover
Inventory turnover shows how fast you sell and replace stock. The formula is simple:
Inventory Turnover = Cost of Goods Sold ÷ Average Inventory
If your turnover is 6, you sell through your inventory six times per year. If it drops to 2, products sit on shelves for months, tying up cash.
This metric directly affects liquidity. The Monthly Retail Trade Inventories Report estimates end-of-month retail inventories and inventories-to-sales ratios. And when that ratio rises, it signals that goods are moving more slowly relative to demand.
Slower movement means more cash locked inside inventory instead of available for payroll, marketing, or expansion. High turnover usually signals strong demand or efficient stock planning. Low turnover can mean overstocking, weak sales forecasting, or declining product-market fit.
The key risk is cash compression. If you purchase $200,000 worth of inventory but only sell through half of it quickly, the remaining $100,000 sits idle. That idle cash cannot fund growth.
Revenue Per Employee
Revenue per employee measures how much revenue each team member generates on average. The formula is:
Revenue Per Employee = Total Revenue ÷ Number of Employees
If your business generates $4 million annually with 20 employees, revenue per employee equals $200,000.
This number matters because productivity drives margin. The U.S. Bureau of Labor Statistics tracks output per worker as a primary indicator of economic productivity. Businesses that increase output without proportionally increasing labor costs typically improve profitability.
A commonly used benchmark in many service and knowledge industries is generating three to four times an employee’s fully loaded annual salary in revenue. If an employee costs $75,000, including benefits and taxes, healthy revenue per employee might range from $225,000 to $300,000.
Payroll to Revenue Ratio
Payroll to revenue ratio shows how much of your total revenue goes toward labor costs. The formula is:
Payroll to Revenue Ratio = Total Payroll Expenses ÷ Total Revenue
Payroll expenses should include gross wages, employer taxes, benefits, bonuses, and commissions. Many owners underestimate this ratio because they calculate wages only.
For many small businesses, a healthy payroll-to-revenue ratio falls between 15% and 30%.
However, labor-intensive industries like hospitality, healthcare, and personal services often operate above 30%. The Bureau of Labor Statistics reports compensation as one of the largest expense categories across service sectors.
Operating Expenses
Operating expenses include the daily costs required to keep the business running.
They include rent, utilities, marketing spend, subscriptions, insurance, administrative costs, and other overhead. The key metric here is the Operating Expense Ratio.
Operating Expense Ratio = Operating Expenses ÷ Revenue
If your business generates $2 million in revenue and spends $1.4 million on operating expenses, your ratio is 70%.
Many small businesses operate within a 60% to 80% range for operating expenses, depending on industry and structure. However, what matters most is trend direction.
According to a survey, rising input costs and operating expenses rank among small business owners' top concerns. When operating expenses rise faster than revenue, profitability weakens even during sales growth.
Protect your margins before they shrink
Monitor labor costs and operational performance automatically
How to Use Small Business Metrics Effectively
Here’s how to actually use small business metrics to drive decisions instead of reacting emotionally.
Focus on Trends
Single data points rarely tell the full story. A slow week does not mean demand is collapsing. A strong month does not guarantee sustainable growth.
What matters is movement over time. Month-over-month comparisons reveal direction.
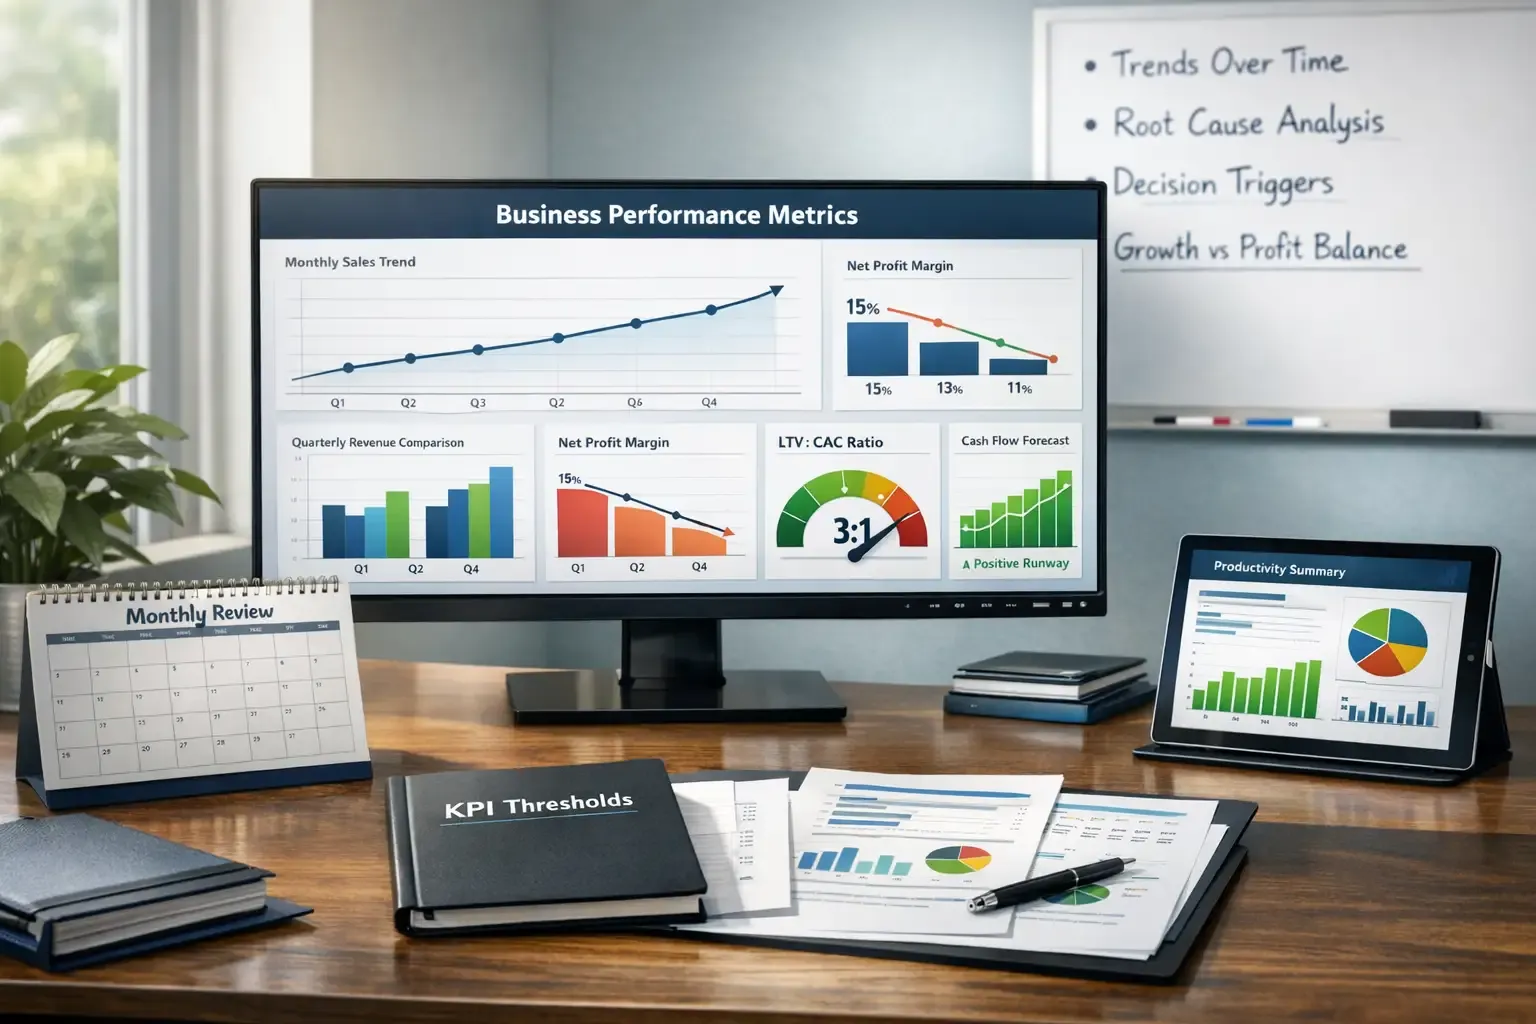
For example, if your net profit margin declines from 15% to 13%, that might not require action. But if it drops steadily over three months, you are looking at a structural cost issue. That pattern could signal rising operating expenses, supplier pricing changes, or inefficient scaling.
Quarter-over-quarter analysis adds deeper clarity. It filters out seasonal distortions. Retail businesses typically experience Q4 revenue spikes. Service-based businesses often slow down during summer periods. Without comparing similar quarters, you risk making unnecessary adjustments.
Balance Growth With Profitability
Revenue growth is attractive. But growth without margin protection creates long-term pressure.
If revenue increases 25% but net profit margin falls from 14% to 6%, the business has expanded volume but weakened efficiency. Higher payroll, marketing costs, and overhead may be absorbing the revenue gains.
The same principle applies to customer metrics. If Customer Acquisition Cost increases, Customer Lifetime Value must increase proportionally.
A widely accepted benchmark across many industries is maintaining at least a 3:1 LTV to CAC ratio. If acquisition costs approach lifetime value, scaling becomes unsustainable.
Likewise, protecting margin without investing in growth creates stagnation. If profit remains steady but revenue plateaus for multiple quarters, competitive positioning may weaken over time.
Avoid Reacting to Single Data Movements
Overcorrection is one of the most common operational mistakes.
If churn increases slightly one month, the immediate reaction might be discounting or aggressive retention campaigns. But before acting, break the number down.
Is churn concentrated in one customer segment? Did pricing change? Was onboarding delayed?
Similarly, if operating expenses rise, isolate the category. Marketing costs? Software subscriptions? Contractor hours? Total expense figures without breakdowns create false urgency.
Every metric movement should trigger analysis, not panic.
The operational habit to build is this: investigate before adjusting. Confirm root cause before implementing change. Small businesses that make incremental corrections outperform those that make dramatic swings.
Connect Every Metric to a Decision Lever
Metrics only create value when they trigger action.
If payroll-to-revenue rises above your comfort threshold, define the response. That might mean pausing hiring, reallocating workloads, or improving pricing strategy. Without predefined decision rules, payroll creep goes unnoticed until margins tighten.
If inventory turnover slows, the response may involve adjusting purchase quantities, launching promotions, or renegotiating supplier terms.
If cash runway shortens, accelerate receivables, reduce discretionary spending, or restructure payment schedules.
Every KPI should answer one question: what will we do if this crosses our limit?
When you define thresholds in advance, decision-making becomes consistent. Without thresholds, metrics become passive observations.
Use Tools and Dashboards to Maintain Consistency
Manual tracking introduces delays and inconsistencies. As businesses scale, automated reporting becomes necessary.
Accounting software and KPI dashboards centralize financial health, customer growth metrics, and operational efficiency indicators. Automated updates eliminate reporting lag and reduce dependency on manual spreadsheet preparation.
Financial visibility significantly improves liquidity management. When profit and cash flow are reviewed regularly rather than sporadically, early adjustments prevent larger disruptions.
However, tools only improve execution when paired with disciplined review habits.
Establish a Structured Monthly Review Process
Effective use of metrics requires routine evaluation.
Set a fixed monthly review session dedicated to performance analysis. During that review, assess financial health, customer metrics, and operational efficiency together. Reviewing them separately hides cause-and-effect relationships.
Begin with month-over-month comparisons. Then review quarter-over-quarter direction. Identify:
What changed? Why did it change? What action will we take? This structured approach transforms metrics into operational guidance.
Over time, patterns become easier to detect. Payroll growth misalignment becomes visible earlier. Cost inefficiencies surface before damaging margins. Customer behavior shifts become detectable before revenue declines.
When you centralize your financial, customer, and operational data in one place, this process becomes much easier to manage. Fieldservicely helps you see trends in payroll, job performance, cash flow, and productivity without juggling spreadsheets. That way, your metrics stop being reports you glance at and start becoming decisions you confidently act on.
Spreadsheets don’t show the full story
Centralize your KPIs in one real-time control panel
Common Mistakes When Tracking Small Business Metrics
Tracking Too Many Numbers at Once
The first major mistake small businesses make is tracking too many metrics at the same time. When you monitor everything that moves, you lose focus on what actually drives performance.
I’ve seen dashboards with 25+ KPIs where no one knows which number truly matters. Instead of improving clarity, it creates decision fatigue. McKinsey reports that simplicity and clarity in performance goals help organizations more effectively measure and drive performance.
When every number feels important, none of them actually are. That’s how businesses become average across the board instead of excellent where it counts.
Ignoring Cash Flow Until It Hurts
The second common mistake is ignoring cash flow because revenue looks healthy. Many businesses assume profit on paper equals money in the bank.
But that assumption breaks quickly.
The U.S. Bureau of Labor Statistics continues to report that cash flow problems remain one of the top contributors to small business failure in the early years. A company can show strong sales and still struggle if receivables lag or expenses outpace incoming payments.
Revenue measures activity. Cash flow measures survival.
If you don’t track operating cash flow regularly, you only discover problems when payroll or supplier payments become stressful. By then, the adjustment window is already narrow.
Focusing Only on Revenue Growth
The third mistake is focusing only on revenue growth while ignoring efficiency. Revenue feels exciting because it signals expansion.
However, revenue alone hides underlying pressure.
If sales increase but gross margin declines, operating expenses rise, or customer acquisition cost climbs sharply, growth becomes expensive. Harvard Business Review has repeatedly emphasized that growth without operational discipline weakens long-term resilience.
Revenue tells you how much you’re selling. Profit margin tells you how well you’re selling.
When businesses chase top-line growth without monitoring cost structure and margin, they scale complexity faster than stability.
Not Connecting Metrics to Decisions
The fourth mistake is tracking numbers without linking them to clear decisions. A KPI without a defined action plan becomes passive reporting.
If churn increases, what changes? If the payroll ratio rises, what adjustment follows? If inventory turnover slows, what is the next move?
Strong operators define thresholds in advance. When a metric crosses a limit, it triggers a response. Without that connection, teams review reports but hesitate to act.
Metrics should influence behavior immediately. If they don’t, they become background noise.
Treating Metrics as Reports Instead of Strategy Tools
The final mistake is treating metrics as reporting requirements rather than strategy tools. Some businesses review KPIs monthly simply to “check performance,” but they don’t align them with strategic goals.
When metrics lack connection to goals, they lose purpose.
For example, tracking social engagement without tying it to conversion rate or revenue impact turns analysis into a vanity observation. Measuring website traffic without linking it to sales funnel efficiency creates surface-level insight.
Stop tracking numbers that don’t move profit
Monitor margin, payroll, and productivity instead
Conclusion
Small business metrics are the control system that keeps your business stable, profitable, and scalable. When you focus on the right KPIs, track trends instead of noise, and connect every metric to a decision, you reduce guesswork and increase clarity.
Track 5–10 essential metrics, review them consistently, and avoid vanity data. When used properly, small business metrics help you protect cash flow, improve margins, and grow with confidence instead of reacting under pressure. That’s how you turn data into real business control.
Frequently Asked Questions
What is the most important small business metric?
The most important small business metric is cash flow. Cash flow shows how much money is actually coming in and going out, which determines whether you can pay payroll, rent, and suppliers on time. Many businesses fail because they run out of cash, which makes liquidity the ultimate survival metric.
What is a good net profit margin for a small business?
A good net profit margin for a small business is typically around 10%, while 20% is considered strong in many industries. Net profit margin measures how much revenue remains after all expenses, including payroll, rent, taxes, and operating costs. If your margin falls below 5%, it usually signals pricing, cost control, or efficiency issues that need immediate attention.
How often should small businesses track metrics?
Small businesses should track key metrics monthly, with cash flow monitored weekly. Monthly tracking allows you to compare trends, spot margin shifts, and detect cost increases before they become serious problems. Quarterly reviews help identify larger performance patterns and strategic direction.
What is the difference between CAC and CLV?
Customer Acquisition Cost (CAC) measures how much you spend to acquire one new customer. Customer Lifetime Value (CLV) measures the total revenue that a customer generates over their entire relationship with your business. For healthy growth, CLV should be at least three times higher than CAC, ensuring your marketing spend remains profitable.

