Field Productivity: Formula, KPIs, Challenges & Fixes
Updated on 26 Feb 2026
Jump to
Summary

Field productivity shows how well field teams use time, tools, and people to finish jobs and earn money.
Key numbers like first-time fixes, repair time, work hours, travel time, and money per worker show if work is rising or falling.
Poor scheduling, long travel, repeat jobs, paper forms, and low skills are the main reasons work slows down.
Low field productivity increases labor waste, delays projects, and damages customer trust.
Improve workflow, use smart technology, and automate processes to increase field productivity.
Field productivity shows how well field teams use people, tools, time, and supplies to finish jobs. It shows how much real work a tech, crew, or sales rep does during paid hours.
Field productivity also affects customers and costs. When it is high, teams fix things faster, avoid repeat visits, and cut extra pay.
Many teams struggle to keep work strong. Poor schedules, long drives, repeat fixes, paperwork, and slow updates can slow the day and lower output.
In this blog, we explain what affects field productivity, the big problems teams face, and what poor results really cost. We also share simple ways to improve it.
What Is Field Productivity?

Field productivity shows how well teams outside the office finish their work. It measures how labor, equipment, materials, and time turn into completed jobs at the site.
In simple terms, it asks one question: Are you getting good results from the hours and resources you pay for?
Here is why this is important.
The U.S. Bureau of Labor Statistics reports that labor productivity affects labor cost per unit in fields like construction and service work. When productivity drops, labor cost goes up, and profits fall. Even a small drop in output can raise total project costs over time.
Let me share a simple example.
Imagine a field service company with 20 technicians. Each technician works 8 hours per day. If each one finishes 5 jobs daily, the company completes 100 jobs per day. If delays, equipment problems, or paperwork lower that to 4 jobs each, total output drops to 80 jobs.
Those 20 lost jobs mean less revenue, longer wait times, and higher costs. That is how field productivity affects business results.
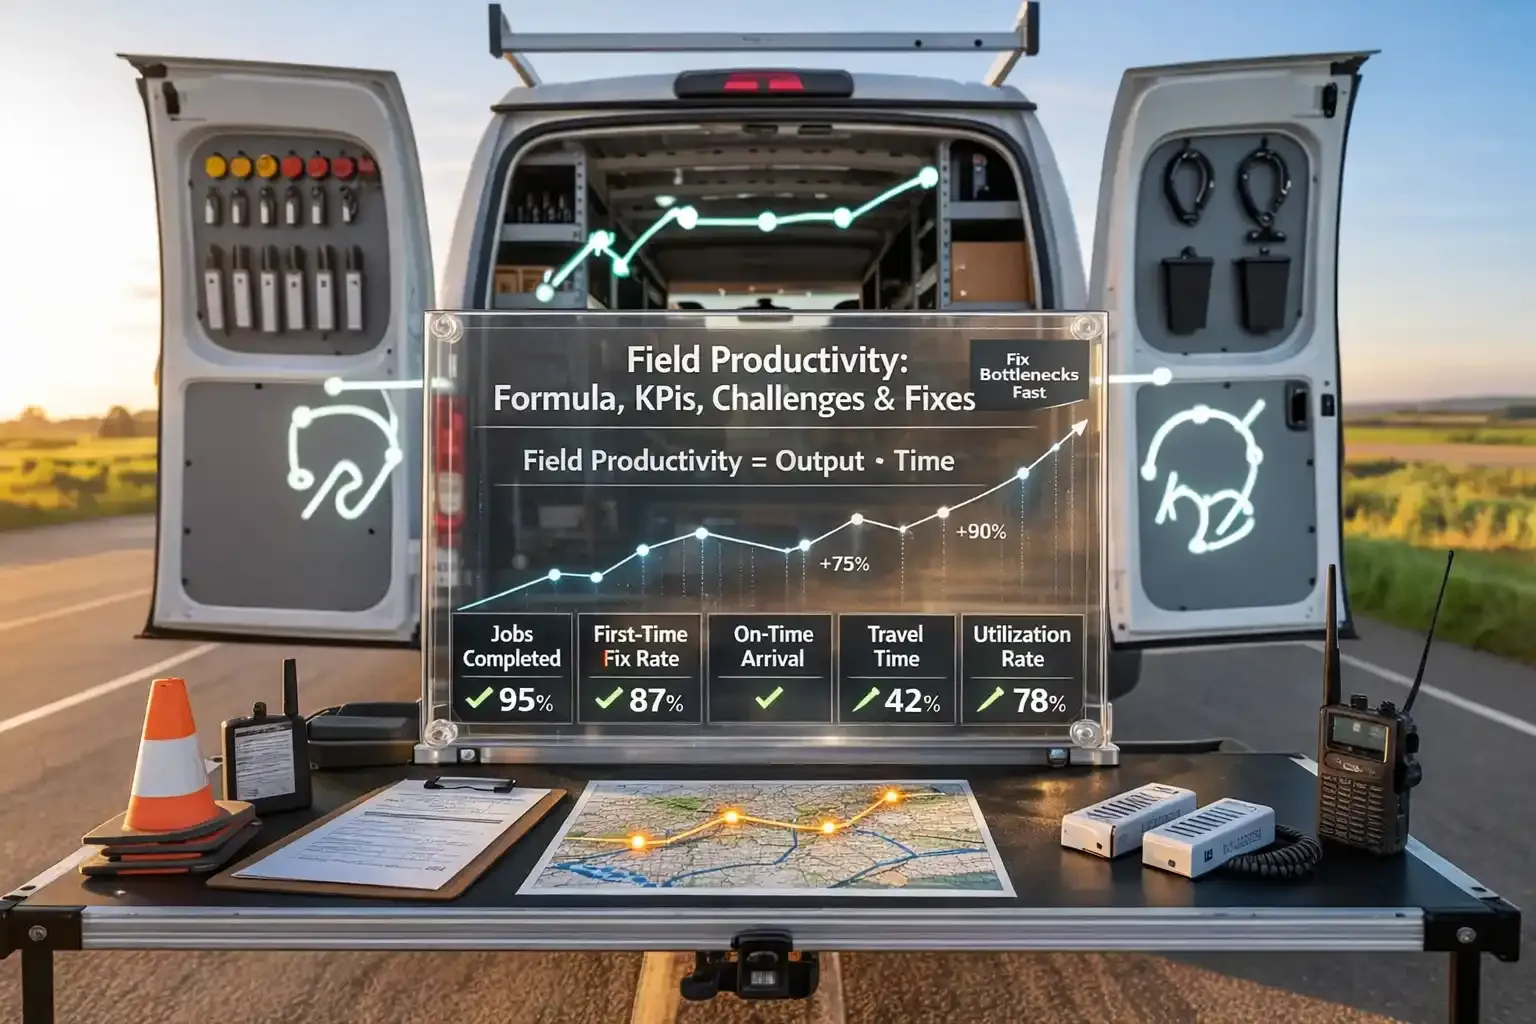
Field Productivity Formula & KPI Metrics
At its core, the field productivity formula is simple.
Field Productivity = Total Output ÷ Total Input.
Output means completed jobs, finished installations, repaired equipment, or even total service revenue. Input means labor hours, travel time, equipment use, and materials consumed.
If your team completes 120 jobs in 240 labor hours, that’s 0.5 jobs per hour. That number is your starting point. Now let’s talk about the KPIs that explain that number.
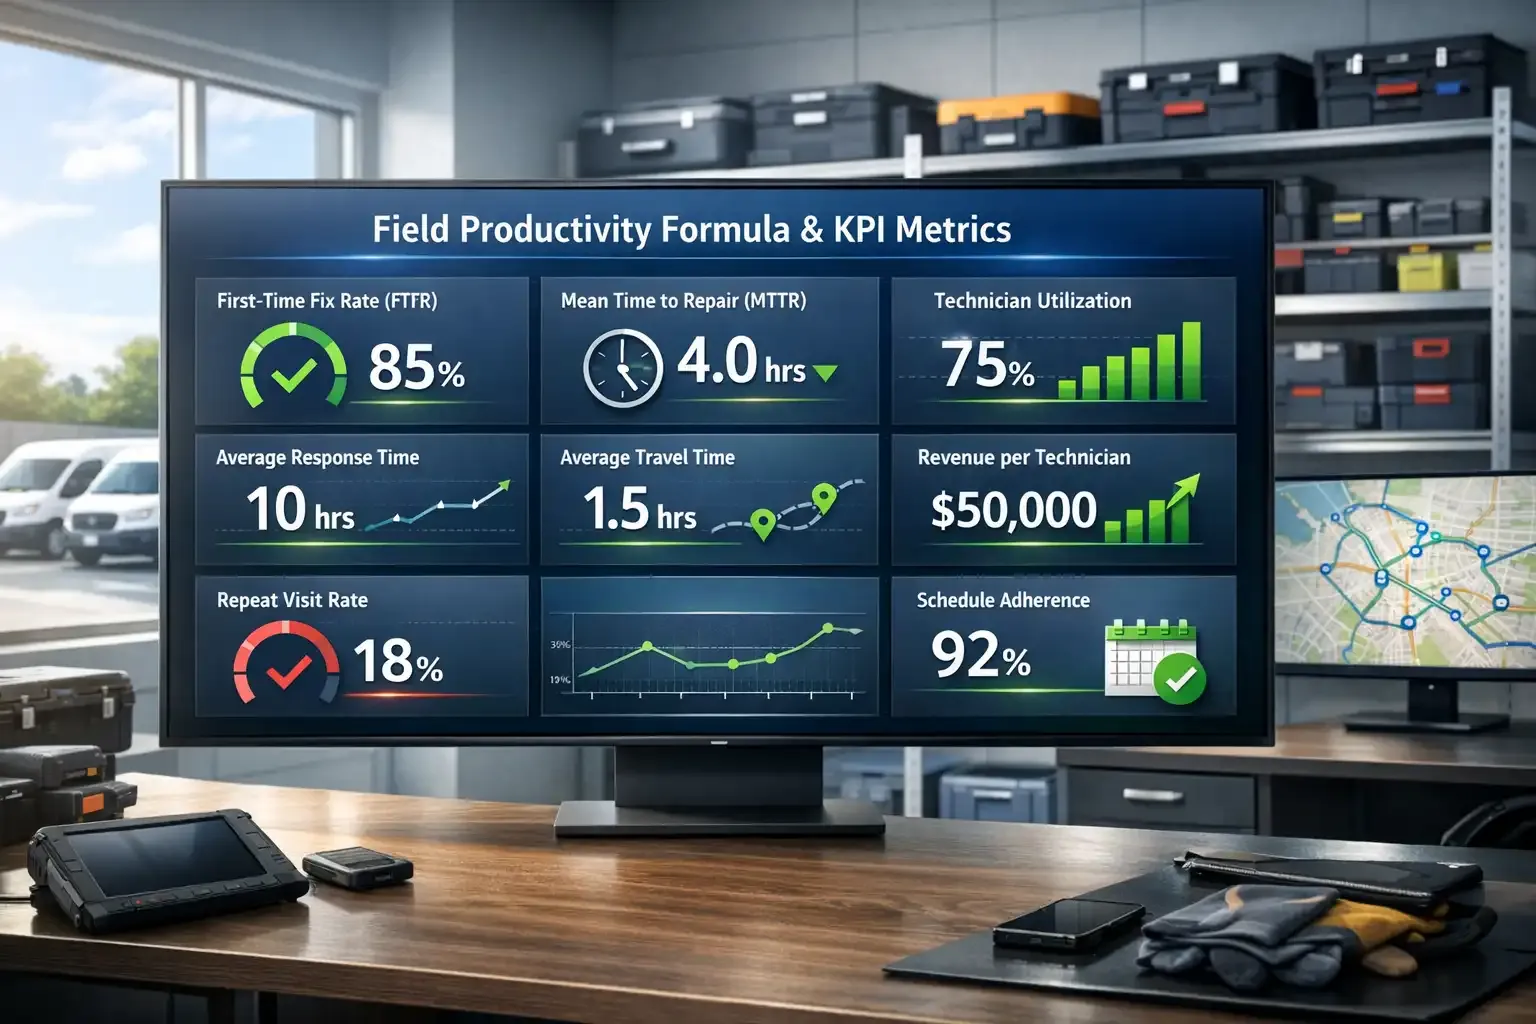
First-Time Fix Rate (FTFR)
First-Time Fix Rate shows how often your technicians solve a problem on the first visit. It is one of the clearest indicators of field efficiency.
FTFR = (Number of Jobs Fixed on First Visit ÷ Total Service Calls) × 100
If your team handles 100 service calls and resolves 82 of them without returning, your FTFR is 82 percent.
Why does this matter so much? Because repeat visits drain profit. They double the labor cost for the same job and increase fuel expense.
According to the Field Service Benchmark Report, top teams fix over 85 percent of jobs on the first visit. Teams below 75 percent often have wrong parts data, poor testing, or not enough training.
When FTFR improves, productivity improves. Fewer repeat visits mean more capacity for new jobs.
Mean Time to Repair (MTTR)
Mean Time to Repair measures how long it takes to complete a repair once work begins.
MTTR = Total Time Spent on Repairs ÷ Total Number of Repairs
If your team spends 300 total hours completing 75 jobs, your MTTR is 4 hours per repair.
Shorter repair time increases daily job capacity. But speed alone does not guarantee productivity. If technicians rush jobs and create callbacks, overall output suffers.
According to Forbes, the average cost of downtime is about $8,581 per minute worldwide. Most field service companies do not face losses at that level. However, longer repair times still raise labor costs and can lead to SLA penalties.
Lower MTTR usually happens when teams prepare better, can see the full job history, and have the right parts ready. It rarely improves just because managers tell technicians to work faster.
Technician Utilization Rate
Technician utilization shows how much of a technician’s day is spent on productive or billable work.
Utilization = (Billable Hours ÷ Total Available Work Hours) × 100
If a technician works 8 hours but only 6 hours are spent on real service tasks, utilization is 75 percent.
This number shows whether your team is working or waiting. Long travel time, paperwork, poor scheduling, and missing parts can quickly lower utilization.
Utilization directly affects revenue per technician. When productive hours increase, output grows without the need to hire more staff.
Average Response Time
Average response time shows how long it takes your team to act after receiving a service request.
Average Response Time = Total Time to Respond ÷ Number of Service Requests
If your company handles 50 service calls in a total of 500 hours, the average response time is 10 hours.
Customers notice this metric right away. Fast response builds trust. Slow response hurts retention and loyalty.
69% of customers say quick resolution is the most important part of a good service experience.
Lowering response time usually depends on smarter dispatching and better route planning. It does not mean forcing technicians to work faster.
Average Travel Time
Travel time eats productivity.
Average Travel Time = Total Travel Hours ÷ Total Jobs
If technicians spend 150 hours traveling across 100 jobs, that is 1.5 hours per job.
Every hour spent driving is an hour not spent servicing customers. Field leaders generally try to keep travel under 15 percent of total work hours. When travel exceeds that, territory planning usually needs adjustment.
Route optimization can reduce travel time by 10 to 20 percent. That improvement directly increases daily job capacity without increasing headcount. Reducing travel time often delivers faster results than improving technical speed.
Revenue per Technician
Revenue per technician turns productivity into clear financial results.
Revenue per Technician = Total Service Revenue ÷ Total Number of Technicians
If your company earns $600,000 in service revenue with 12 technicians, revenue per technician is $50,000.
This metric shows whether your operations actually create profit. Two companies may finish the same number of jobs, yet earn very different revenue. Pricing, job type, and technician skill level often make the difference.
Repeat Visit Rate
Repeat visits measure how often technicians return to fix the same issue.
Repeat Visit Rate = (Number of Jobs Requiring Follow-Up ÷ Total Jobs) × 100
If 18 out of 100 jobs require another visit, the repeat rate equals 18 percent.
High repeat visits signal diagnostic issues, missing parts, or skill gaps. They also reduce the capacity for new revenue.
When repeat visits drop, technician schedules open up. That creates room for more profitable work.
Schedule Adherence
Schedule adherence measures how often technicians arrive on time.
Schedule Adherence = (On-Time Arrivals ÷ Total Scheduled Jobs) × 100
If technicians arrive on time for 92 out of 100 jobs, adherence equals 92 percent.
Customers remember late arrivals. High schedule adherence improves customer satisfaction and SLA compliance. Low adherence usually traces back to unrealistic scheduling or excessive travel.
Improve First-Time Fix Rates Without Hiring More Staff
Connect scheduling, time tracking, payroll, and revenue metrics in one system
The 6 Core Drivers of Field Productivity

When I first started looking at why our field productivity kept dipping, I thought the problem was simple. Maybe the team needed to work faster. Maybe we needed more technicians.
I was wrong.
Field productivity falls because friction builds up in very specific areas. And once I started breaking it down, I realized almost every issue came from six core drivers.
Let’s go through them one by one.
Information Velocity
Here is something I have learned: slow information hurts productivity.
When job details arrive late or miss key data, technicians have to stop and wait. I have seen technicians spend 15 to 20 minutes calling the office just to confirm part numbers. When this happens all week, that lost time becomes lost revenue.
According to McKinsey, real-time, data-driven digital coordination and service tools can improve operational efficiency. These tools also reduce service delays and increase response speed in field operations.
When systems are not linked, problems grow. If job history is in one place and parts data is in another, techs must guess.
Paper forms slow work even more. Writing by hand takes time. This shows weaker efficiency gains compared to other sectors. [Source: U.S. Bureau of Labor Statistics]
Equipment Reliability
Now let’s talk about tools.
I’ve had days where the schedule looked perfect on paper, but one vehicle breakdown destroyed the whole plan. Equipment reliability decides whether work even starts.
When tools fail, productivity stops immediately.
Preventive maintenance helps more than most managers think. According to research, predictive maintenance reduces unexpected downtime and improves asset availability.
Then there’s utilization. The formula is:
Equipment Utilization = (Operating Time ÷ Available Time) × 100
If you own tools that sit idle half the time, you’re tying up capital without increasing output. Reliable equipment doesn’t prevent delays. It keeps productivity steady.
Dispatch & Scheduling Logic
Poor dispatch logic destroys productivity. I’ve seen teams drive across town for low-priority jobs while urgent tickets waited.
According to a study, structured task prioritization improves SLA compliance and retention. When you send the right technician to the right job at the right time, things move faster.
Travel time is another silent killer. Study shows that route planning tools reduce travel time by 15 percent. That’s the difference between completing four jobs per day and five.
Real-time rescheduling matters too. Cancellations happen. Traffic happens. Teams using dynamic dispatch systems report stronger technician utilization.
Skill Density & Workforce Capability
Skill gaps show up in performance data.
I have seen two technicians handle similar jobs. One finishes the job in two hours. The other takes four hours and still needs a callback.
Field services show that structured skill tracking and proper training programs lead to higher first-time fix rates.
Training gaps waste valuable time. When technicians lack product knowledge, they take longer to troubleshoot problems. Certification programs reduce that guesswork. Research shows that companies investing in continuous training see fewer repeat visits and better service margins.
Incentive & Behavioral Motivation
Let’s talk about something most managers underestimate: motivation.
When incentives reward speed alone, quality drops. When bonuses reward balanced KPIs, employee behavior improves, and performance becomes more consistent.
According to Gallup, engaged employees produce higher output than disengaged teams.
Low morale reduces productivity. You won’t see it in one bad day. You’ll see it in declining utilization and slower repair times.
People don’t just work by schedule. They work for clarity and recognition.
Environmental Friction
Finally, there’s the stuff you can’t control.
Weather disrupts field operations. NOAA confirms increasing variability continues to affect outdoor industries. Rain, extreme heat, and storms stretch job timelines.
Site conditions slow work too. Tight access, unstable ground, and restricted spaces increase setup time. You can’t eliminate that friction, but you can plan around it.
Regulatory checks add another layer. Safety inspections and permit requirements extend service time. If you don’t account for them in scheduling, they create bottlenecks.
Fix Dispatch Logic Before Hiring More Technicians
Use smart scheduling and route optimization to increase daily job capacity without increasing payroll
The Cost of Poor Field Productivity
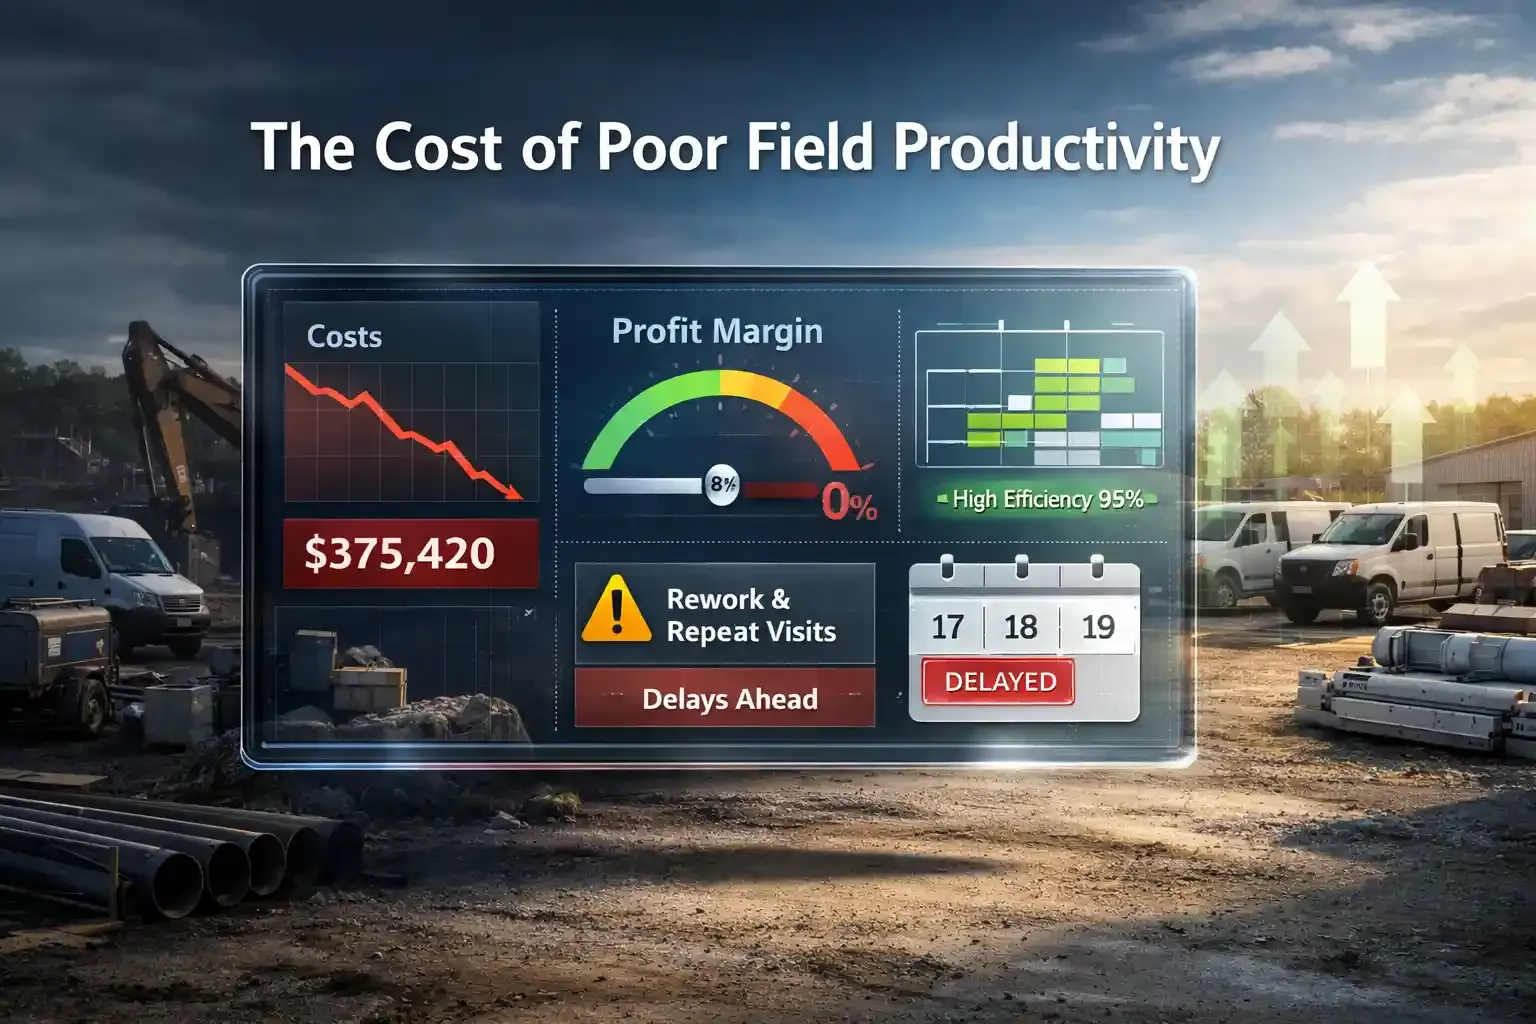
When field productivity drops, the damage spreads across labor hours, equipment use, fuel costs, and customer trust. By the time you notice shrinking margins, the loss has already happened.
Let’s break down where the money actually goes.
Labor Waste
Labor waste is the first place where money disappears.
The field service industry estimates that U.S. contractors still lose between $30 and $40 billion. That loss comes from waiting time, rework, poor coordination, and unproductive field hours.
If 10% of your field labor produces no real output, your margin shrinks. In industries where margins often sit between 2% and 8%, that waste can erase profit.
Project Delays and Budget Overruns
Project delays increase cost faster than most managers expect.
2025 industry benchmarks confirm that 60 %–70 % of projects still finish late or over budget. Poor productivity contributes through slow coordination, idle crews, and rework cycles.
When a project falls behind early, teams rush to recover time. Rushed work increases mistakes. Mistakes create more delays.
Rework and Repeat Visits
Rework doubles the labor cost for the same task.
When crews redo completed work, they consume new labor hours without creating new value. In field service, repeat visits generate fuel expense, travel time, and opportunity loss.
If one technician revisits two jobs per day, weekly capacity drops fast. Over months, that lost capacity equals lost revenue.
Idle Equipment and Fleet Costs
Idle equipment continues to generate cost.
Fleet vehicles and heavy tools require insurance, maintenance, and depreciation regardless of usage. When poor scheduling leaves equipment waiting between assignments, you pay without producing output.
Low equipment utilization reduces return on capital. That silent cost compounds over time.
Margin Erosion
Low productivity erodes margins.
When labor hours increase but output stays flat, cost per job rises. With margins already tight in field-intensive industries, even small inefficiencies reduce profitability.
A 5% productivity drop can wipe out a 5% margin. That math leaves no cushion.
Customer Trust and Revenue Loss
Delayed jobs damage customer trust.
Slow response times and repeat visits frustrate clients. In competitive service markets, poor reliability leads to contract loss and reduced renewals.
Revenue does not decline immediately. It declines as customers look elsewhere.
Protect Your Profit from Hidden Field Waste
Track labor hours, travel time, and utilization in real time with FieldServicely
Proven Strategies to Improve Field Productivity
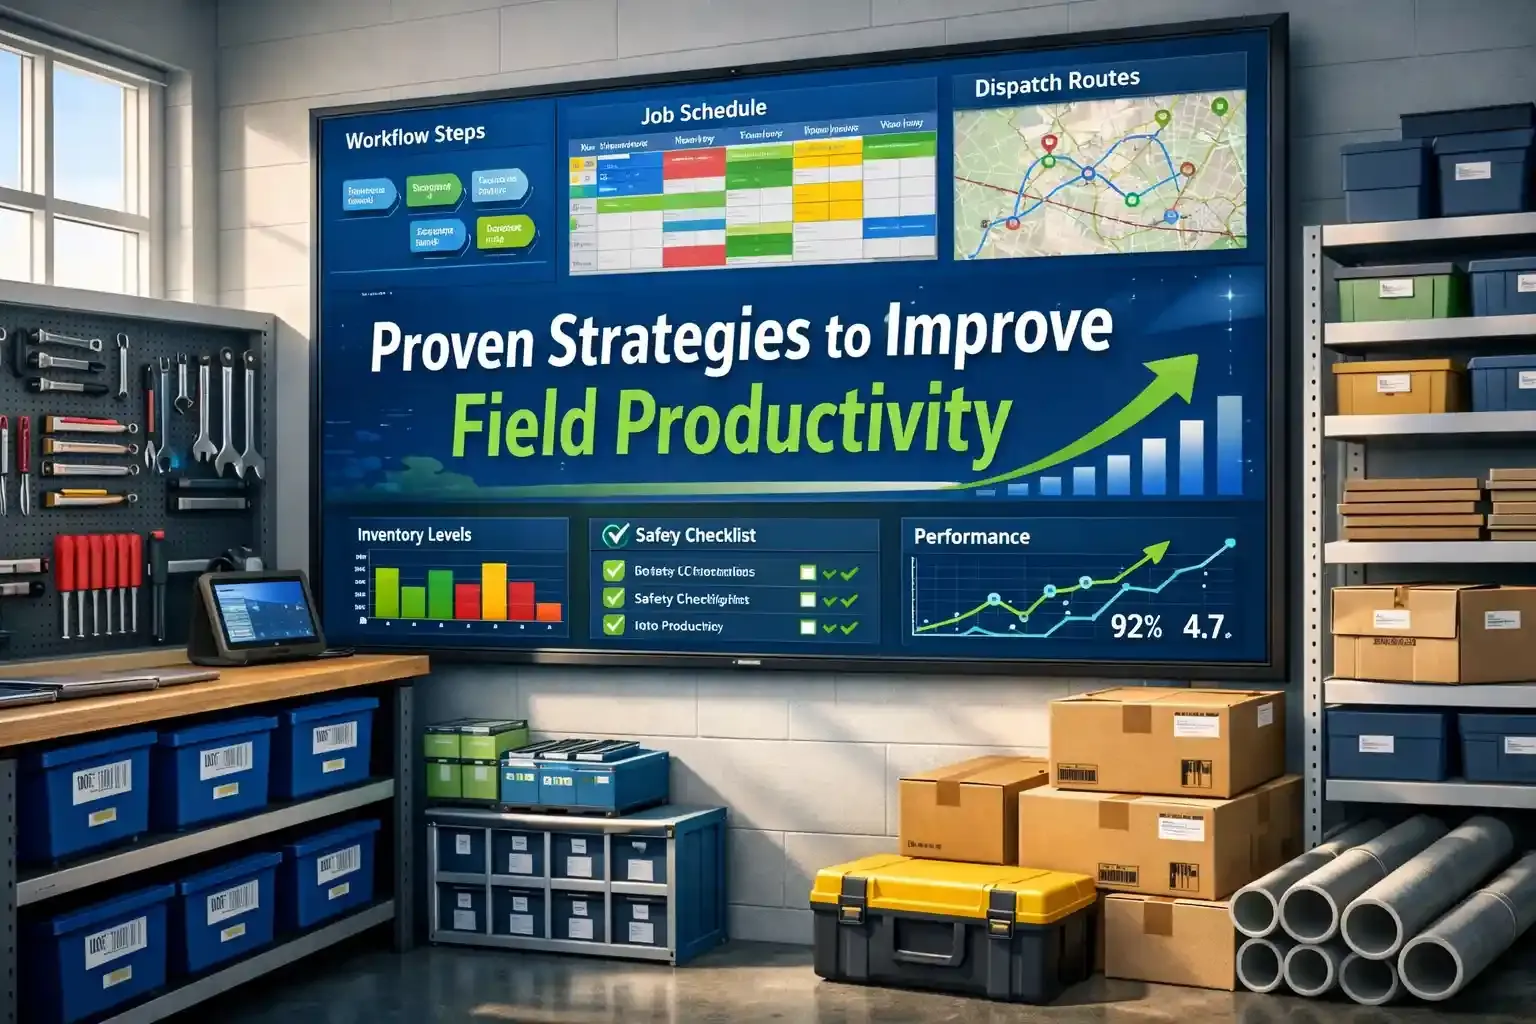
When field productivity slips, most managers react the same way. They push teams to work faster or hire more people.
That rarely works.
Productivity improves when you remove friction from the system. Over the years, I’ve seen the same strategies work across construction, field service, utilities, and sales teams.
Let’s walk through what actually moves the needle:
Streamlining Workflows
Workflow clarity solves half the problem. Standard Operating Procedures (SOPs) reduce guesswork.
When technicians follow clear steps for diagnostics, installation, or reporting, output becomes consistent. Structured pre-job planning remains one of the strongest predictors of labor efficiency.
Task batching reduces wasted motion. When teams group similar jobs in the same location, they reduce setup time and tool switching. Even small batching adjustments can free up hours each week.
Daily check-in workflows keep everyone aligned. A short 10-minute morning sync prevents confusion later in the day. Clear priorities reduce mid-day disruptions and last-minute rework.
Leveraging Technology
Technology improves productivity only when it solves a real problem.
Real-time communication platforms eliminate waiting. When technicians can share updates, delays shrink.
Field service management systems work best when they centralize data. The key features matter more than the brand. Work order tracking, asset history, and parts visibility reduce repeat visits.
Mobile-first access to data changes how field teams operate each day. When technicians can check manuals, job history, and inventory on their phones, they no longer need to call the office for every detail.
Deloitte highlights that digital and mobile tools play a key role. They improve technician productivity and service results.
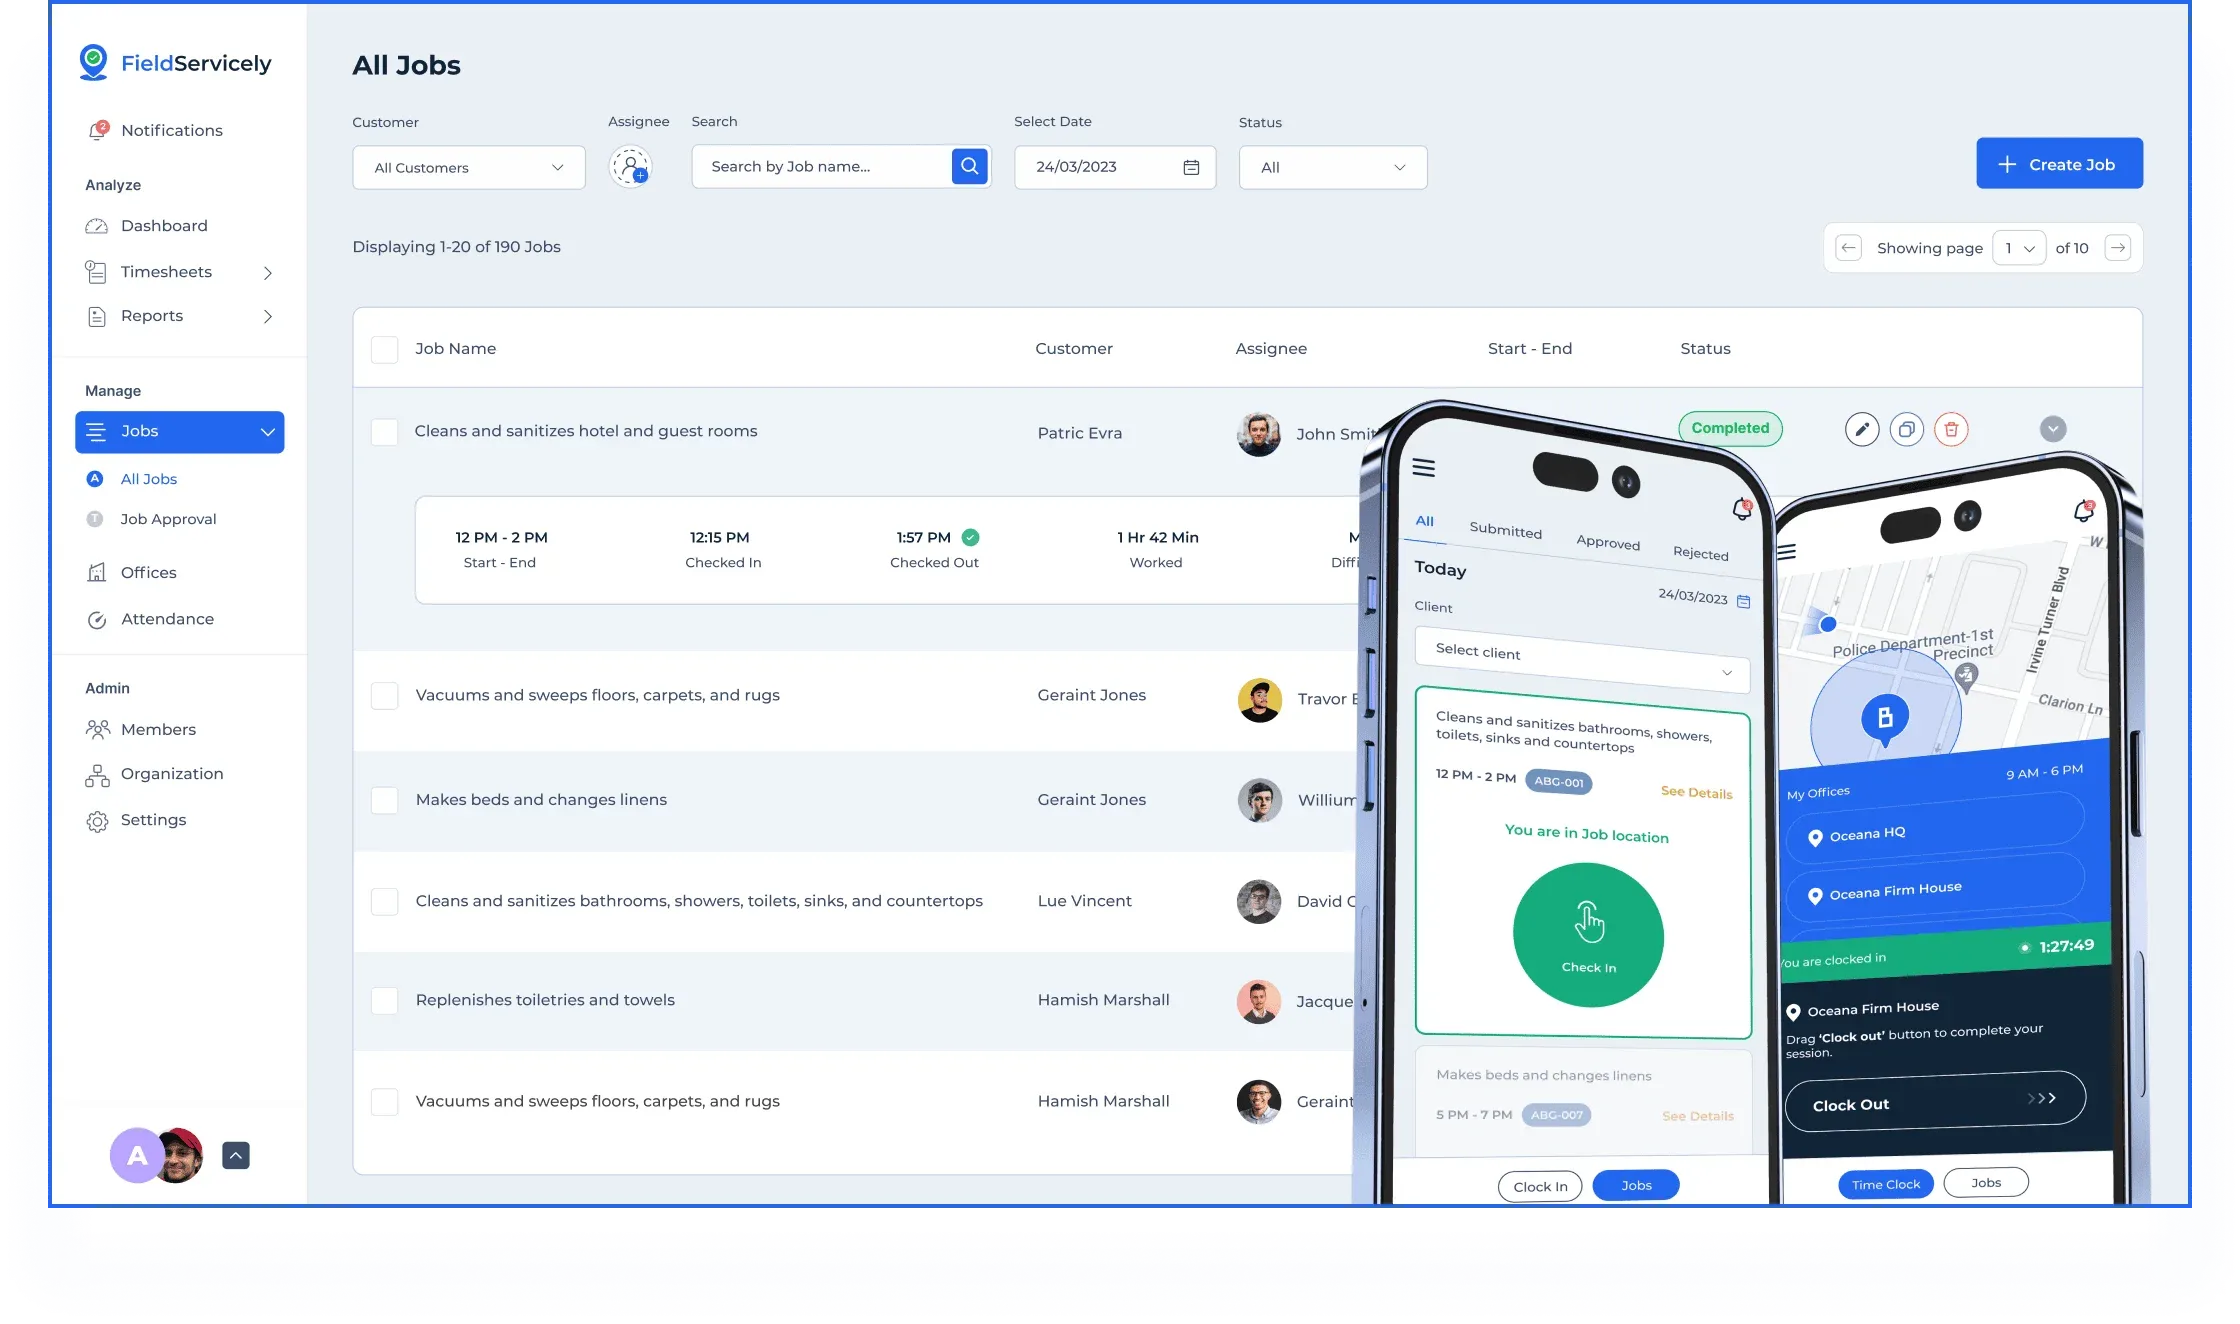
This is where a system like FieldServicely fits into the daily workflow. It combines scheduling, dispatch, and GPS tracking. It also includes geofenced attendance, work orders, timesheets, payroll, and invoicing into one platform.
Managers can monitor job progress in real time, and technicians can complete their work. It reduces switching between multiple apps.
Process Automation
Automation protects productive hours.
Auto dispatch assigns jobs based on location and skill. That reduces manual coordination and improves technician utilization. Companies using dynamic dispatch models report stronger SLA compliance. [Source; Nerdbot]
Auto reporting removes paperwork delays. When systems capture job completion data automatically, technicians avoid duplicate entry. That means more time on-site and less time behind a screen.
Digital forms replace paper inefficiency. Paper forms require re-entry, storage, and correction. The U.S. Bureau of Labor Statistics shows, administrative overhead limit operational efficiency across service sectors.
Automation does not replace people. It protects their time.
Training & Continuous Skill Improvement
Skill density impacts output.
Regular workshops keep technicians current. Product updates, safety refreshers, and new tool training reduce troubleshooting time.
Certification mapping clarifies capability. When managers know which technician holds which certification, job assignment improves. Complex tasks go to qualified people first.
Knowledge sharing accelerates improvement. Peer learning sessions and shared troubleshooting libraries prevent repeated mistakes. Teams that document solutions reduce repeat visits.
Safety and Productivity
Safety drives productivity more than most leaders expect. Safety as a productivity pillar prevents downtime. When injuries drop, schedules remain stable.
Psychological safety increases performance. Gallup shows engaged employees produce higher output than disengaged ones. When technicians feel respected and heard, they work with more focus.
Zero-incident planning reduces long-term disruption. Daily safety briefings and hazard planning prevent emergency shutdowns. Fewer incidents mean fewer schedule collapses.
Optimizing Material & Inventory Management
Materials control field productivity more than most managers realize.
Just-in-time (JIT) delivery reduces idle waiting. When parts arrive exactly when needed, crews stay active. Poor timing forces teams to pause, which increases labor waste.
Predictive forecasting improves parts availability. Data-driven demand models anticipate usage patterns.
Automated re-order points prevent shortages. When systems trigger restocking based on minimum thresholds, parts remain available. That reduces repeat visits and improves first-time fix rates.
Build a Field Operation That Scales Without Chaos
Connect workforce visibility, route optimization, and performance insights in one streamlined solution.
What Are Field Productivity Challenges and How to Solve Them?
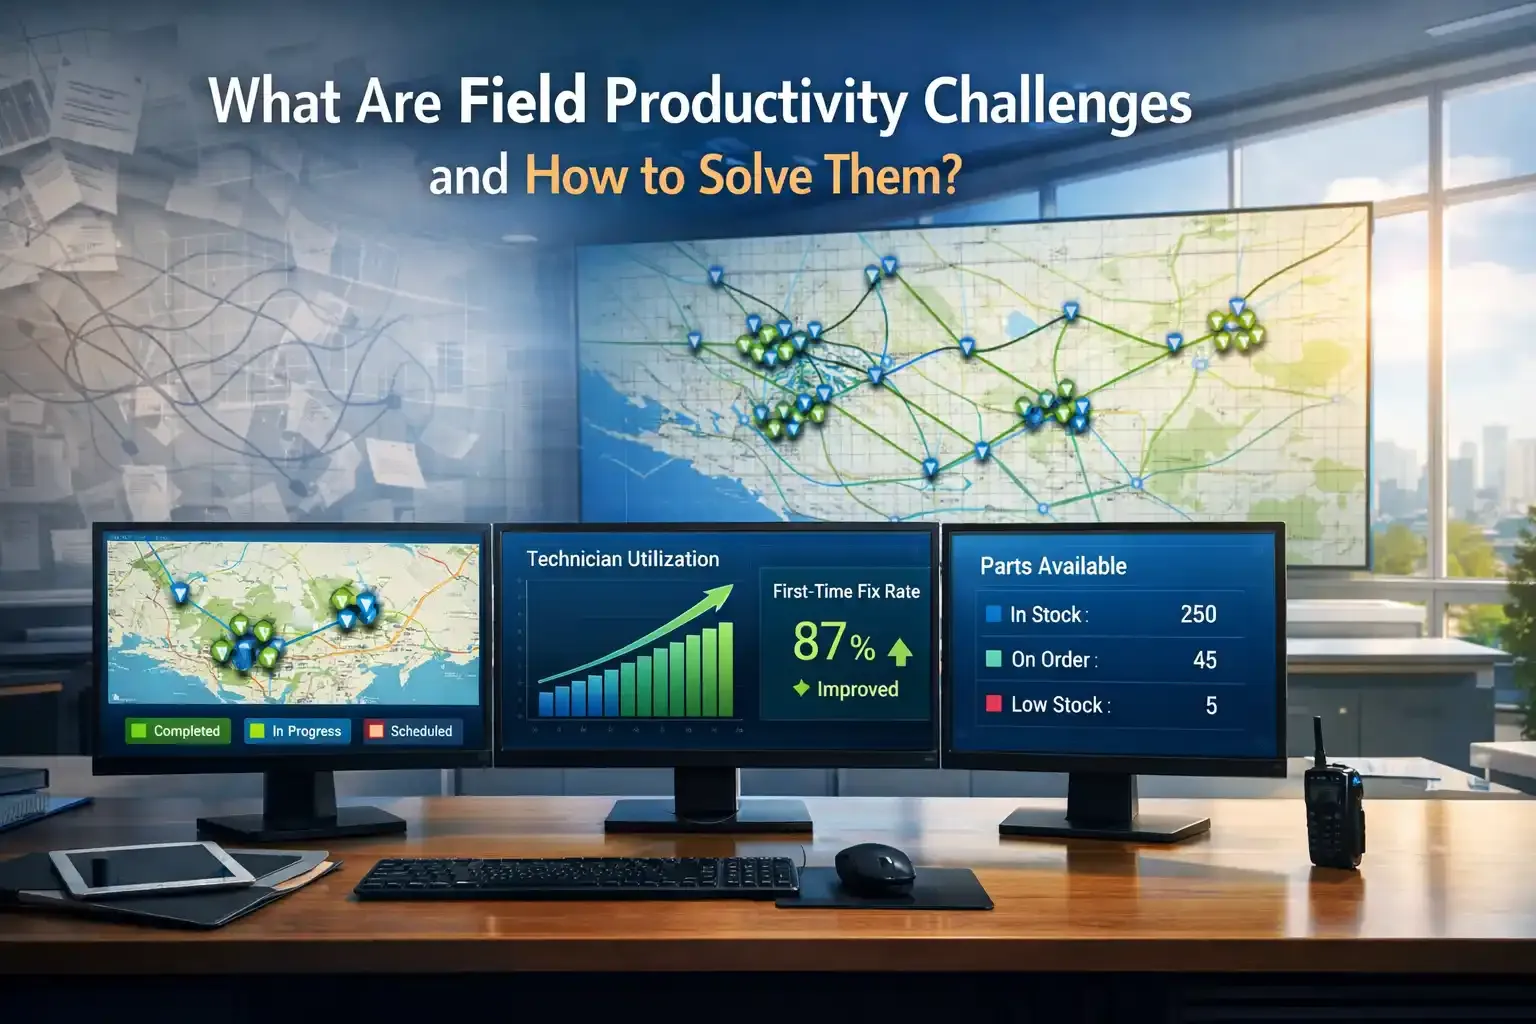
Below are the most common challenges and how to solve them:
Inefficient Scheduling and Dispatching
Inefficient scheduling wastes valuable labor hours. Manual dispatch often ignores technician location, skill level, and job urgency. This creates idle time, travel gaps, and overlapping appointments. Weak dispatch planning lowers technician utilization across the team.
Solution: Use structured, rule-based scheduling instead of manual guesswork. Smart dispatch systems assign jobs based on skill match, distance, and priority. When the right technician handles the right job the first time, both utilization and response speed improve.
Excessive Travel and Route Inefficiency
Excessive travel reduces the number of jobs completed per day. When technicians spend hours driving between sites, fuel costs rise and productive time drops. Optimized routing can cut travel time by up to 15-20 percent.
Solution: Use GPS-based route optimization that adjusts for traffic and technician proximity. Assign jobs in clusters to reduce unnecessary back-and-forth driving. When travel shrinks, daily capacity increases without adding more staff.
Low First-Time Fix Rate (FTFR)
Low first-time fix rates can double service costs. When technicians come back for the same issue, labor and vehicle costs repeat, and customer satisfaction goes down. FTFR is a key metric that shows how well a field service team fixes issues on the first visit. [Source: IBM]
Solution: Give technicians full job history, asset details, and live parts data before they arrive. Keep van inventory accurate and match the right skills during dispatch. Good preparation increases first-visit fix rates.
Paper-Based Processes and Manual Reporting
Paper processes slow reporting and delay billing. Technicians often complete the physical work on site but delay the paperwork until later. This delay increases the risk of errors, missing details, and lost data. Administrative overhead continues to reduce operational efficiency in 2025 field studies.
Solution: Replace paper forms with mobile digital forms. Allow technicians to close jobs, capture signatures, upload photos, and submit reports instantly. When data updates in real time, invoicing and payroll move faster.
Lack of Real-Time Communication
Poor communication creates blind spots between field teams and the office. When job delays are not reported, schedules fall apart, and customers lose trust. Delayed updates increase internal stress and reactive decision-making.
Solution: Implement instant job status updates and automated alerts. Use one shared tool so everyone sees the same live information. Clear visibility reduces surprises and improves control.
Aging Workforce and Skills Gap
Skill shortages slow field productivity. Many experienced technicians retire, while new hires need structured guidance. The 2025 workforce report continues to show persistent shortages in skilled field roles.
Solution: Invest in structured training, certification mapping, and digital knowledge libraries. Encourage peer learning and standardized procedures to reduce skill variance. When knowledge becomes accessible, performance stabilizes across teams.
Technician Burnout and Low Morale
Burnout reduces productivity quickly. Overloaded schedules combined with inefficient systems increase stress and turnover. Disengaged employees consistently produce lower output.
Solution: Balance workloads and remove unnecessary friction from daily operations. Improve scheduling fairness, reduce manual admin tasks, and provide supportive leadership. When systems help technicians instead of slowing them down, morale and output rise together.
Turn Field Challenges Into Operational Control
Centralize scheduling, job data, GPS tracking, and reporting with FieldServicely.
Conclusion
Field productivity shows how well your systems, people, and processes work together each day. When scheduling improves, communication happens in real time, skills match the job, and technology removes friction, output rises on its own.
Poor field productivity slowly drains profit through delays, repeat visits, idle time, and employee burnout. The key is to build smarter workflows, smarter dispatch, and smarter support. When you fix the system, performance follows.
Frequently Asked Questions
How often should field productivity be measured?
Track field productivity every week to manage daily operations and review it each month for bigger decisions. Weekly checks help you catch scheduling or travel issues early. Monthly reviews show patterns in utilization, repeat visits, and revenue per technician.
Does field productivity differ between small and large teams?
Yes, scale increases complexity. Small teams often struggle with multitasking and limited resources. Large teams usually struggle with coordination and communication delays. The main metrics stay the same, but strong systems and discipline become more important as teams grow.
Can field productivity improve without hiring more technicians?
Yes, most gains come from better scheduling and less friction in daily work. Better routes, higher first-time fix rates, and digital reports can increase output by 10 to 20 percent without adding more staff.
How does pricing strategy affect field productivity?
Pricing affects job mix and how technicians approach their work. Low-margin jobs push teams to complete more tasks each day, which can lead to more errors and repeat visits. Smart pricing that matches service complexity supports steady and sustainable productivity.
What role does customer communication play in field productivity?
Clear customer communication reduces wasted visits and rescheduling. Confirmed appointments, clear job descriptions, and pre-visit instructions improve preparation. Better communication increases first-time resolution and schedule adherence.

